Consider this post, part 3 of 3 in the series on using Dynamo and Revit to solve occupancy problems in the pandemic era, is more of an addendum. So much of the effort involved with this project centered around the craft of script-building that it deserved its own discussions and collection of lessons-learned. I’ve built a few mega-graphs like this in my career, and I always wanted to write something about what that’s like. Here I’ll talk about how the COVID office occupancy mega-graph, available in part 2, is structured, and I’ll share my most-distilled advice about how to structure harrowing expeditions into big graphs such as this one.
The COVID Office Occupancy Graph
The office occupancy Dynamo script meant for Generative Design for Revit has three stages: Setup, Design, and Consequences.

The Setup Stage is all straight-forward Dynamo/Revit work: selecting Revit elements, distilling geometry, cleaning up lists, etc. This stage can be more than half the total work for a typical generative design script, but it’s also where you can most easily benefit from using packages and reusing code from problems you’ve already solved. By analogy to cooking, this is where you prepare the ingredients.
The Design Stage can be tricky, but it’s no more complex than an average Dynamo script: ask yourself what are the rules? For the office occupancy script, the design portion is mostly what was covered in part 1, with a single-objective optimization example. The start of this stage is distinguished by the first need for the design inputs—the sliders that Generative Design for Revit will play with while it looks for better designs. This script asks: what’s the minimum allowable distance between occupied seats, and what’s the maximum allowable congestion value per occupied seat? All decisions about the design itself are made in the design phase. In a cooking analogy, this is where you follow the recipe. In most generative design scripts, this stage will usually be the smallest when you zoom out.
In the Consequences Stage, analyze results and determine what to do with them. It can be tricky to write a useful metric, but in general measure your design using a number that you want to either minimize or maximize. Then the work to display results with colors, heatmaps, and writing properties back to Revit elements will be the easiest part of your task. In a cooking analogy, this is where you serve the food and ask everyone to quantify something about their opinion.
Inputs and Outputs
When building a Dynamo mega-graph, keep the future user of the script in mind, even if that’s just you.
- Reduce the number of inputs/outputs to only those you need. If you can derive one input from another, don’t ask a user twice and introduce possibilities for error.
- Make inputs/outputs numeric and something you want to either minimize or maximize.
- Above all, name inputs/outputs clearly.
If it’s hard to name an input or output, it’s too complex. In this script, which output name is clearer?
- “Traffic paths that approach the seat location within the minimum allowable separation with a penalty for nearby constrictions/bottlenecks”
- “Exposure”
Please say #2.
Inputs are distinguished by right-clicking on an input-type node and selecting “Is Input.” Outputs are distinguished by Watch nodes that are renamed. These actions will make the input and output appear in the Generative Design for Revit interface.
Inputs come in a few types, which have everything to do with which stage they apply to. In the occupancy graph, I’ve used a consistent color-coding scheme so that all pink groups are inputs that will be exposed to the user of Generative Design for Revit.

Inputs that occur in the Setup Stage relate to the environment, in our case: which family types should the script consider to be seats, and where will the people on the floor plate walk to (exits, kitchens, bathrooms, etc.). These are likely not inputs that Revit Generative Design would iterate on; they just make the script specific to the office plan. Some environment inputs may be implicit and not directly set by the user. For example, this script derives a lot of information just from the user’s Revit active view: which walls and doors are involved, which furniture elements are seats and which are obstacles to movement, and other data.
Inputs in the Design Stage will be tuned by Revit Generative Design, so these should be sliders. Set the extents of the sliders so that the values are meaningful to the specific floor plate you have. Watch out for differences in units like millimeters vs decimal feet.
Inputs in the Consequences Stage relate to how you want results to affect the Revit model, if at all. Usually you won’t have inputs for users to choose something here, but in case you do, make sure that Revit Generative Design is not set to adjust these automatically.
Remember and Gate Nodes
Generative Design in Revit requires two special types of nodes that aren’t used for anything else in Dynamo. You’ll find the Remember and Gate nodes in the GenerativeDesign package. For a full explanation, see Using Data From Revit in the Generative Design primer. There are plenty of important nuances to be aware of in case you have to troubleshoot, but in general:
Use Remember after any inputs from Revit and Gate nodes before any consequences are sent back to Revit.
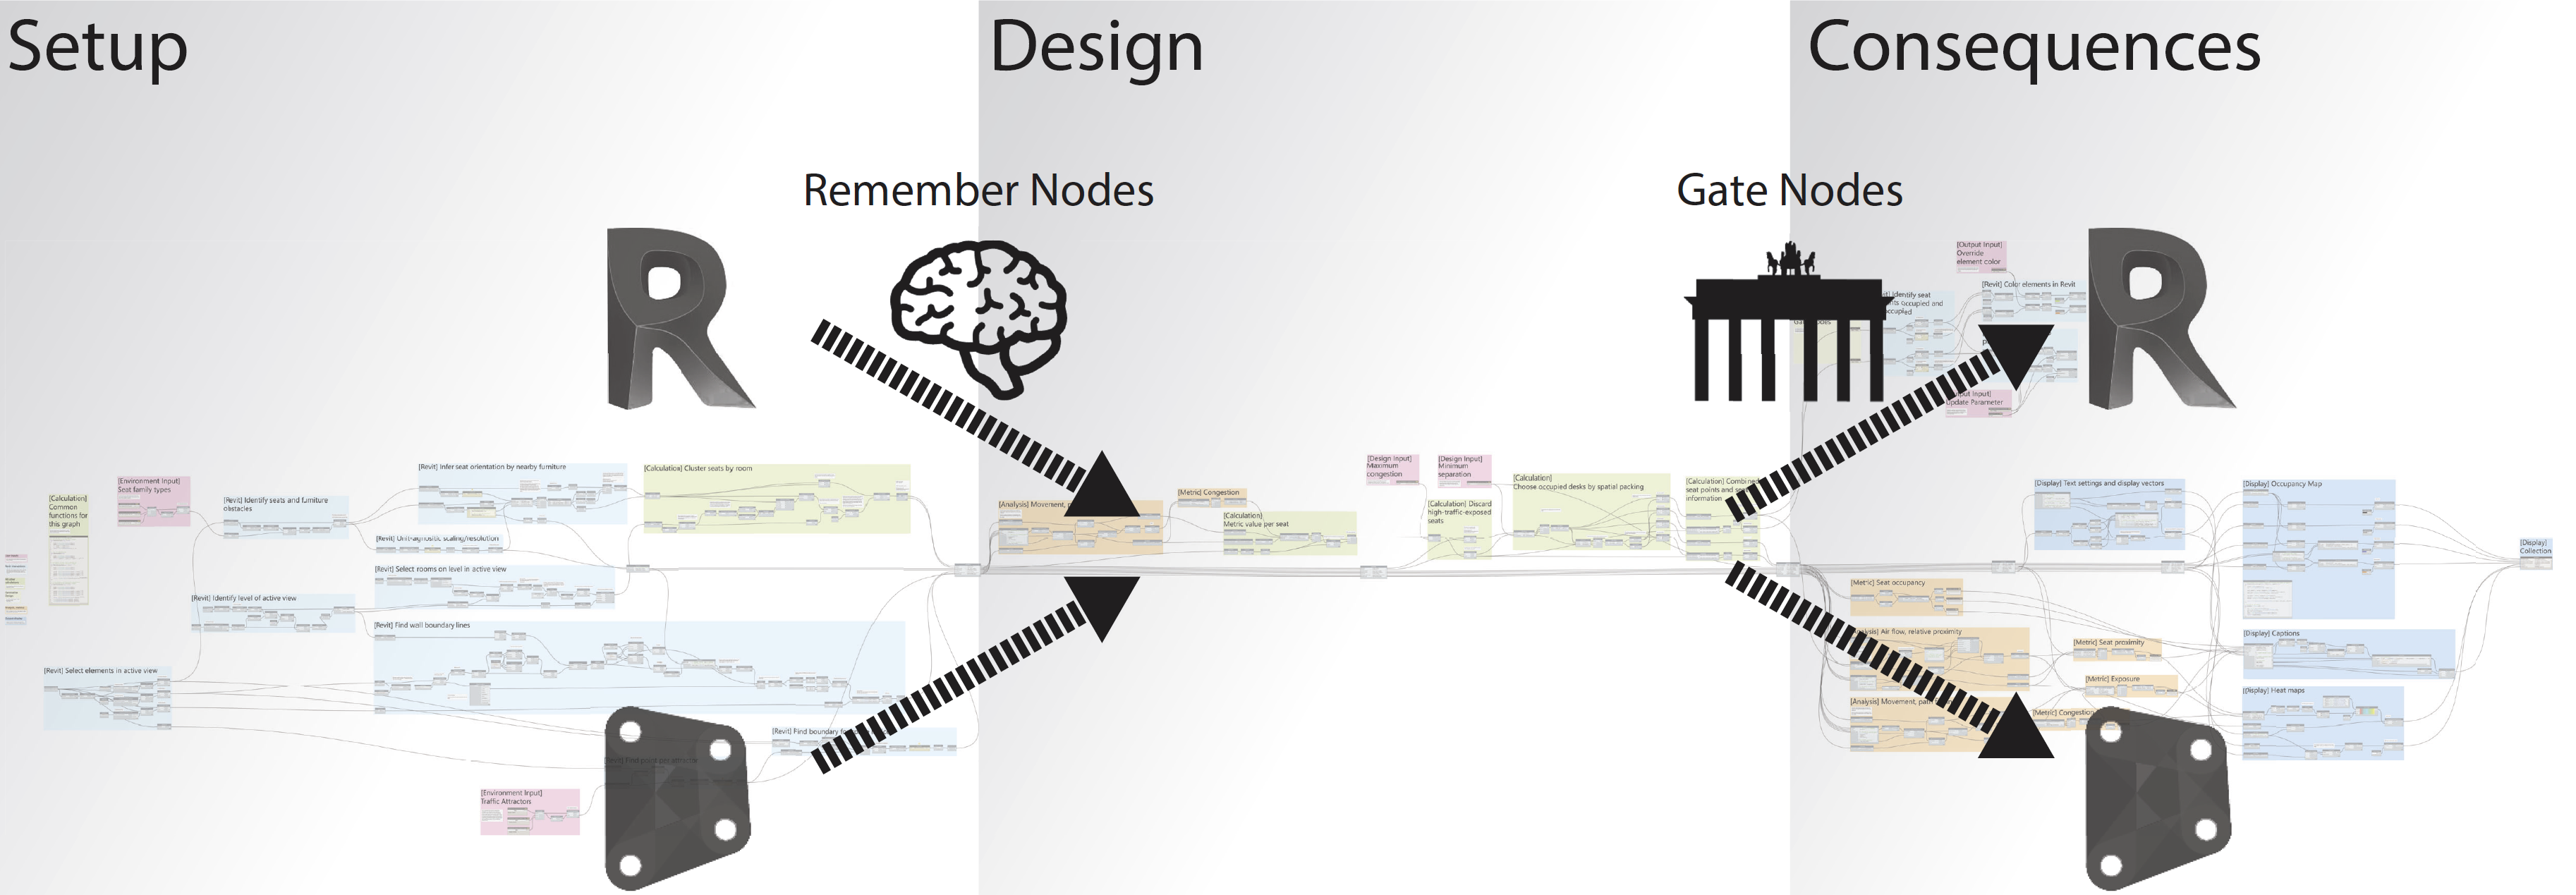
Remember nodes let you remember geometry, numbers, and text from anything upstream even if what was upstream disappears later. Remember nodes won’t be meaningful for a Revit element, but they can remember an element’s geometry or a list of properties. If you reference anything from a Revit project, be sure to “Remember” all the data that’s needed downstream at least somewhere. This will let Revit Generative Design run your script without needing to retrieve data from the Revit model each time. It’s best to stay away from structured lists of things to be remembered, but in case you can’t leave well enough alone, you’ll find examples for how to deal with complex situations in the occupancy graph provided in part 2.
Advice for Mega-Graphs
Mega-graphs can become tangled messes quickly, like how kitchens never stay clean for long in a large family. When your graph is tangled, your logic will get tangled along with it. To keep your head organized, keep your graph organized.
Modular Code
You won’t get it all right the first time, so don’t be afraid to “refactor” parts of your graph when you need it. If you figure out you need a width instead of an area, for example, it might be worth making that consistent across multiple sections. As your understanding of the script evolves, the organization of its parts will probably need to evolve with it.
Keep your code organized into groups so that you can focus on a particular problem at a time. Groups will also help you find bugs more quickly because you can eliminate large sections at a time.
Computational Budget
Be careful how you spend your computational budget—some operations take more time than others, and you’ll need to have a sense for where you’re losing the most time. Geometric calculations tend to take a good amount of time, as does anything with a cross-product. For example, if you find yourself needing to calculate all the geometric self-intersections among a large number of objects, it’s a cue to try to find a more efficient solution so you can afford to use your computer’s power where it’s more important. For a deeper inspection of graph performance, try using the TuneUp package.
Documentation
The single best way to avoid letting your graph devolve into tangled mess is to document everything clearly. Really, you can’t write too much. Here are some of the rules of thumb I try to stick to:
| Give meaning to multiple output ports. |  |
||
| Note where a node came from. |  |
||
| Label Python inputs and outputs. |  |
||
| Say what a Python script should do. |  |
||
Use //comments in code blocks. |
 |
||
| Label groups. |  |
||
| Color groups. |  |
||
| Note anything other than “Auto” lacing. |  |
||
| Label group in puts. |  |
||
| Label group outputs. |  |
||
| Organize long-distance “transmission lines”. |  |
||
| Note when errors are expected or handled. |  |
||
| If order matters, say so. |  |
Thanks!
This post concludes the most ambitious project I’ve ever undertaken for a purely educational purpose. Having already thanked my collaborators, it remains for me to thank the talented managers who made this collaboration possible. Thank you, Lilli Smith, Zach Kron, Mohammad Rahmani Asl, and Thord Backe. Some of the best works come from good people being crammed into a small room, and I’m glad I’ve found myself in many rooms with each you, now with social distancing… optimized!