This is a follow-up post to a previous post, Telling a Story with Generative Design Outcomes.
Summary
In our previous post, we demonstrated a way to export outcomes from Generative Design for further visualization. This feature offers a lot of great flexibility for visualizing results. In that example, we created outcomes with randomization. This resulted in great visualization below.
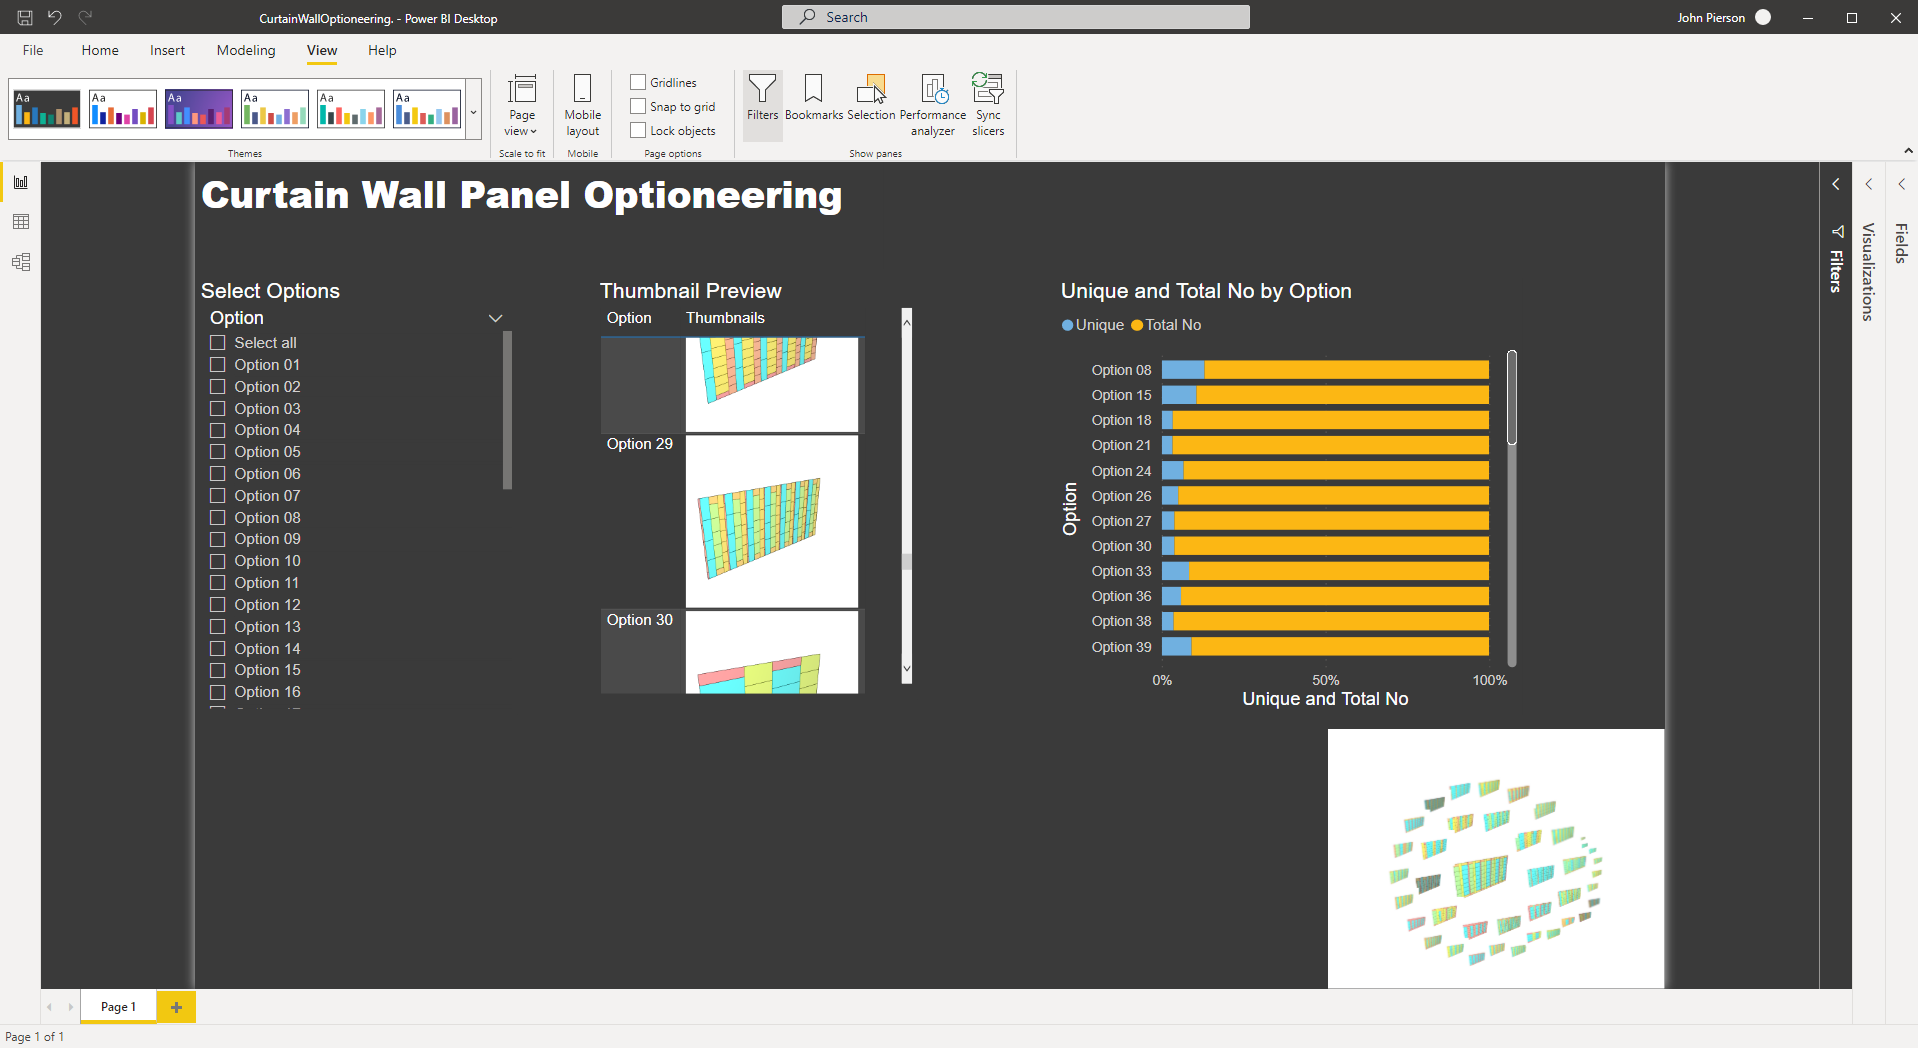
Finished Dashboard in PowerBI
The other portion of this that is available to us with export outcomes is, the ability to visualize our outcomes in a way that is not currently possible in Generative Design, interrogating and visualizing discarded results. With every Generative Design study that is run with Optimization enabled, we generate far more results than we see in the UI.
For this post we will be utilizing the included sample file in the Generative Design dataset, Three Box Massing.
Exporting Outcomes (Including Discarded Options) from Generative Design
To get started we are going to create a new study with the optimize option checked.
First, we will open the Three Box Massing sample.

Three box massing
From this point, we will run the study and export the outcomes.
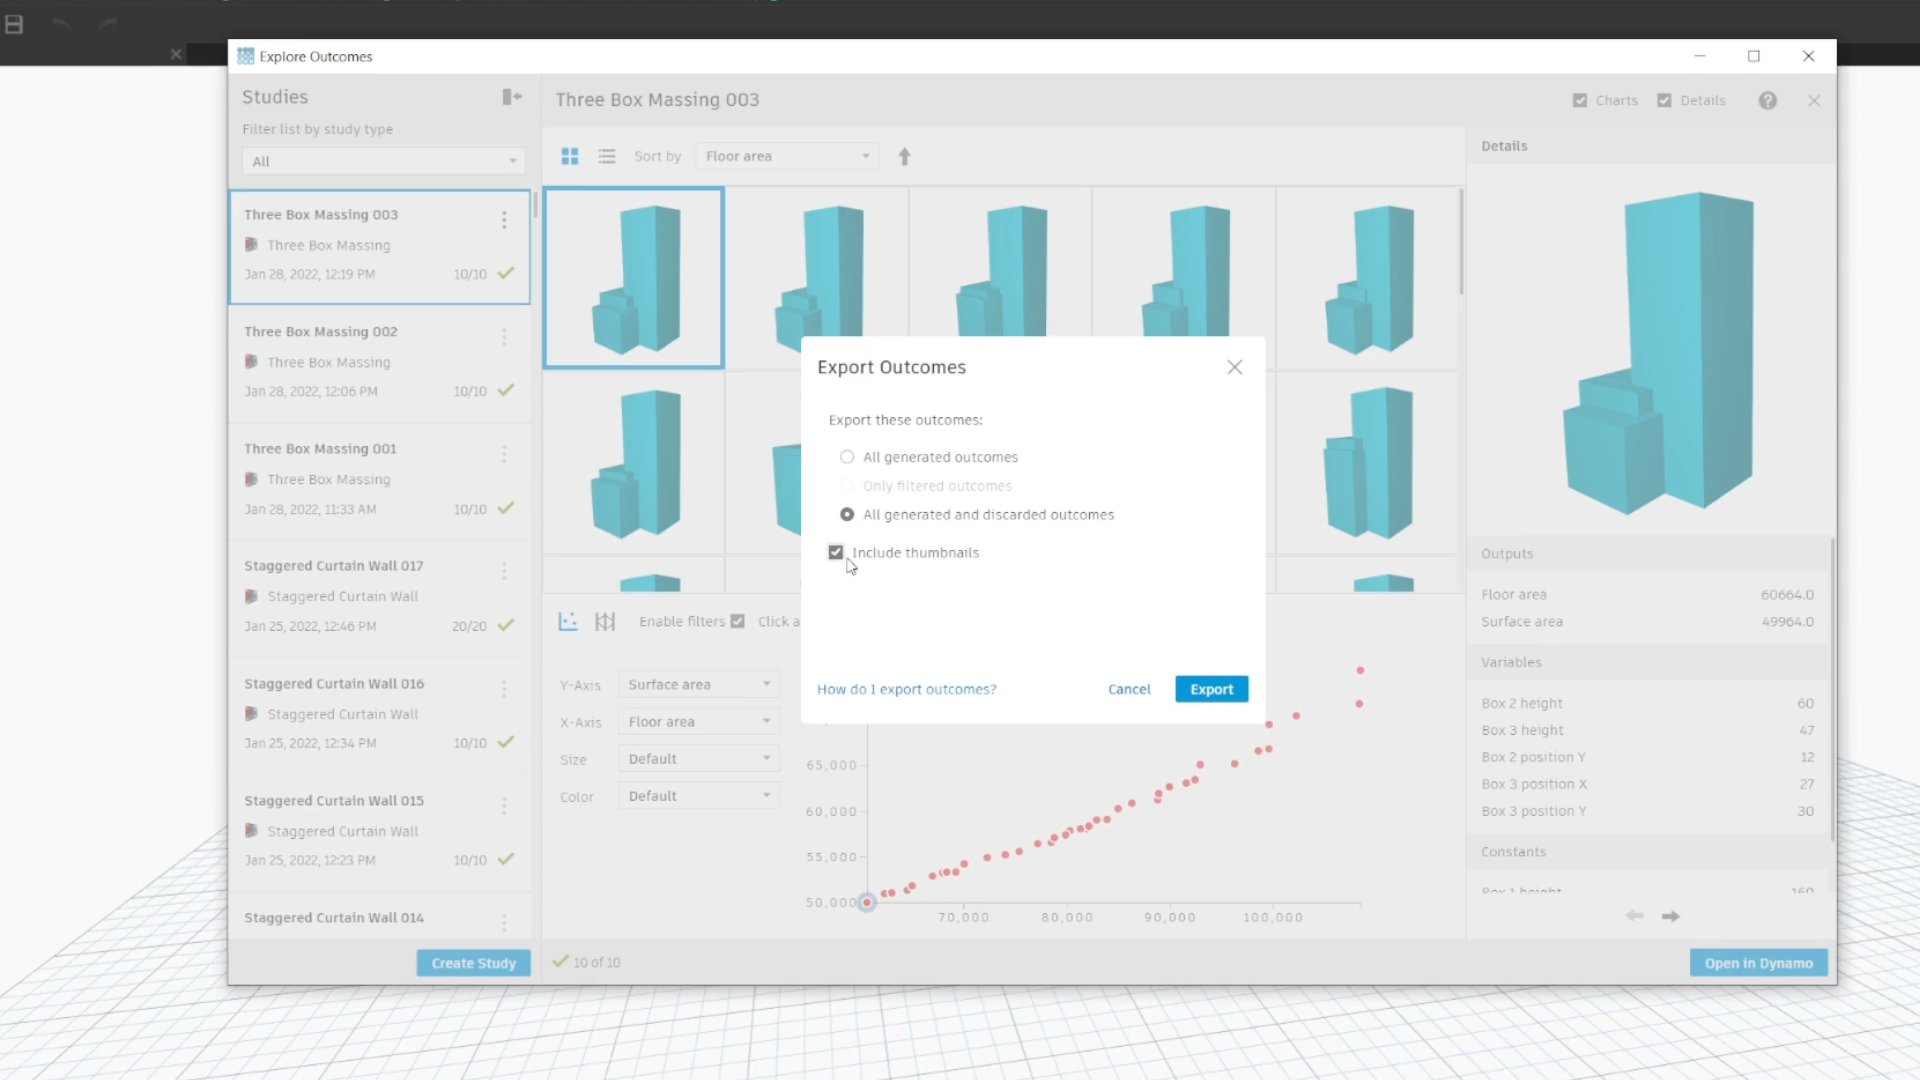
Make sure to include the discarded options this time around!
Preparing the Results for PowerBI
Generative Design exports a CSV file with all of the relevant data. To use this in PowerBI we will need to make a few changes to it. (for a full walkthrough on this process check out the tutorial video linked below).
First, we remove the headers.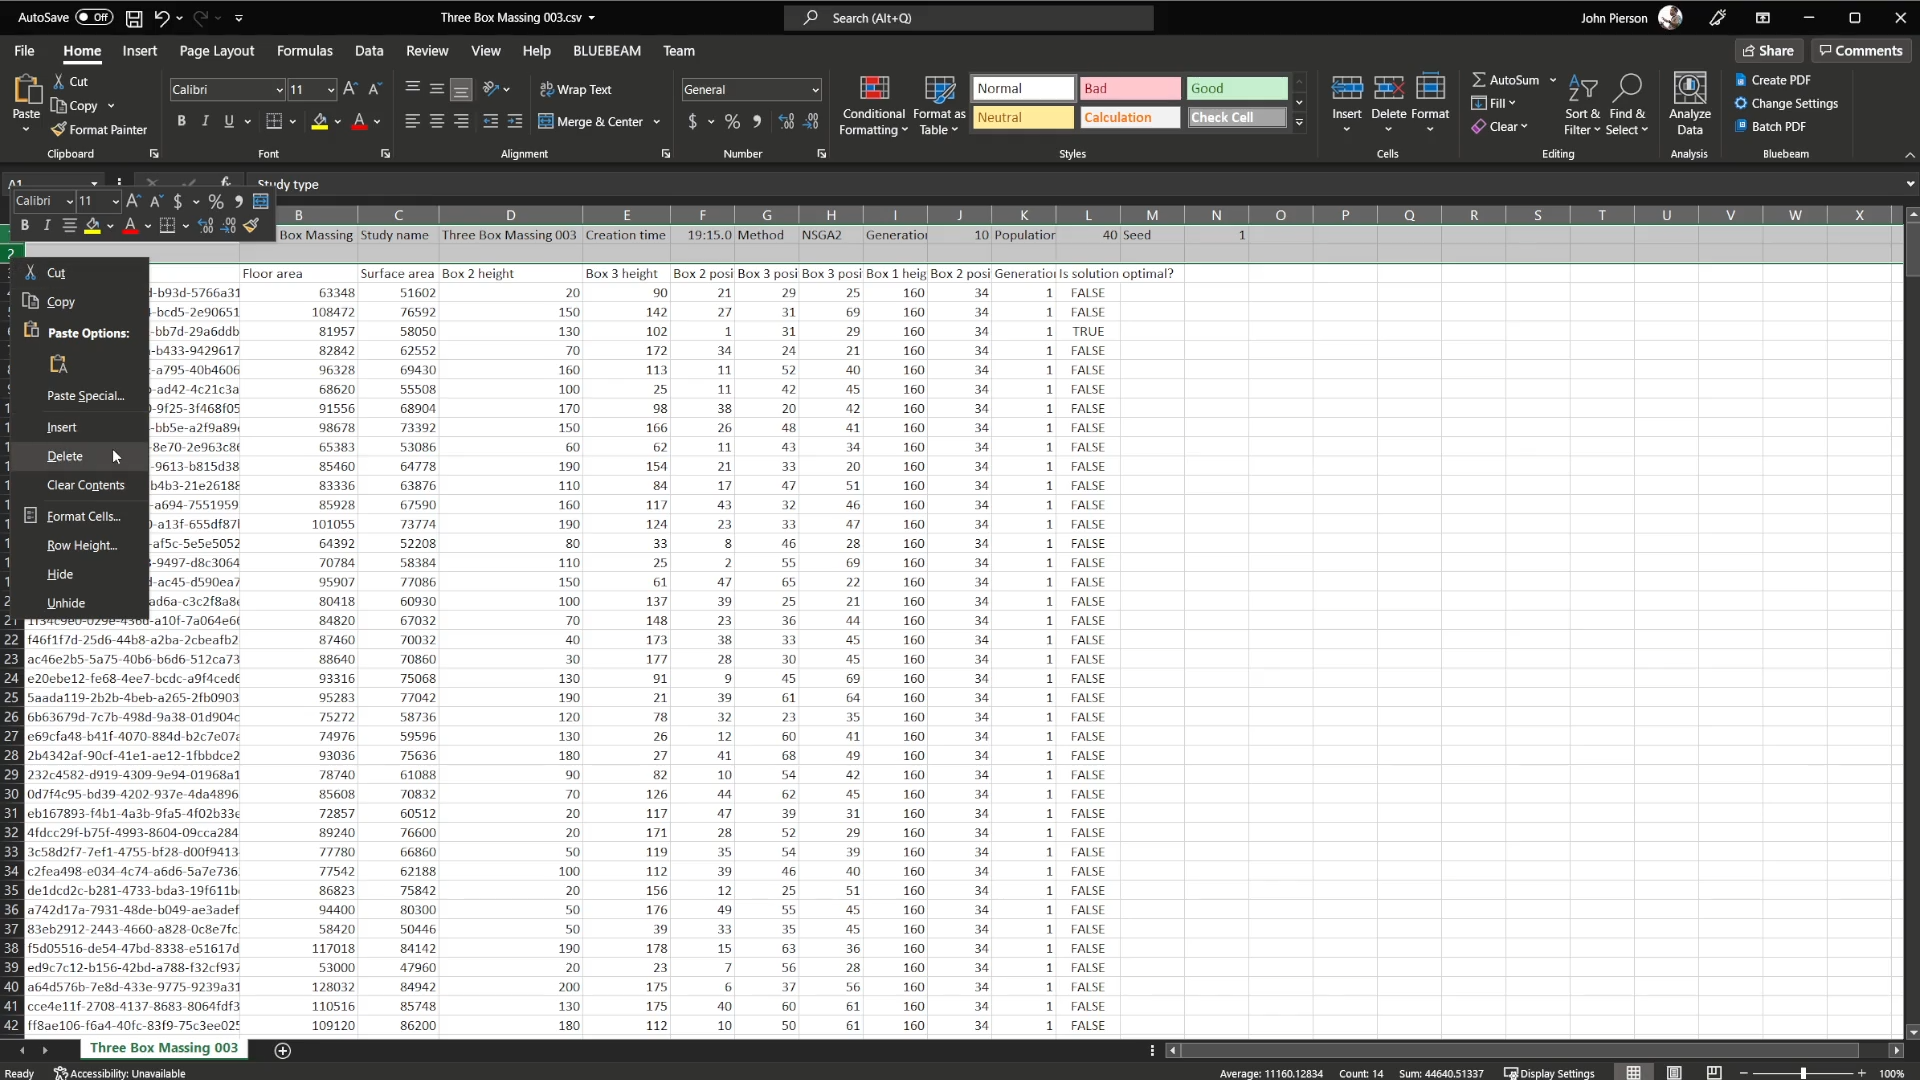
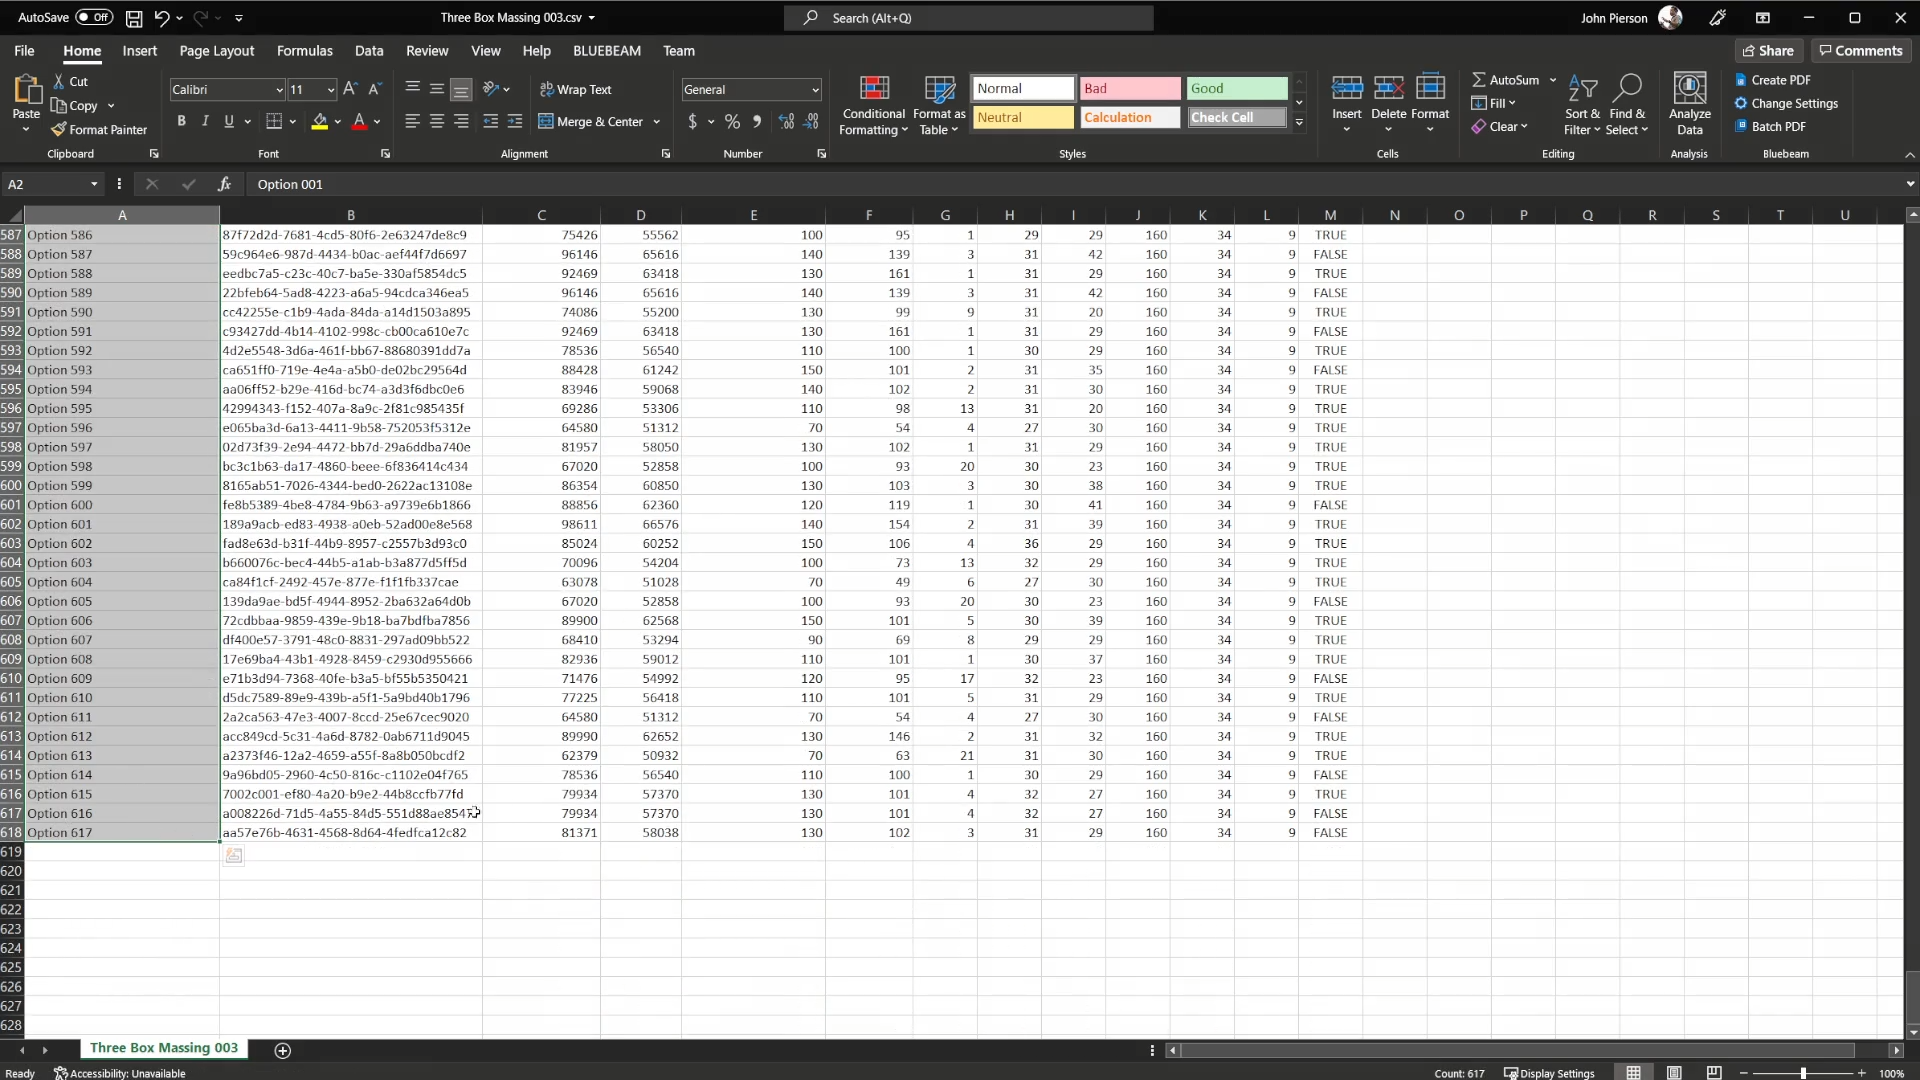
Next, we add option numbers to the sheet. By default, Generative Design uses Unique IDs which are very long unique identifiers.
In addition to modifying the excel file, we need to host our thumbnails somewhere that is publicly accessible. For this example we use Github. (This is also covered in depth in the video below).

Thumbnails Hosted on Public Github Repo
With our thumbnails hosted on a public URL, we can now use Dynamo to add these values to our CSV and write to a new excel file.

Excel Generation Graph with Thumbnail Column
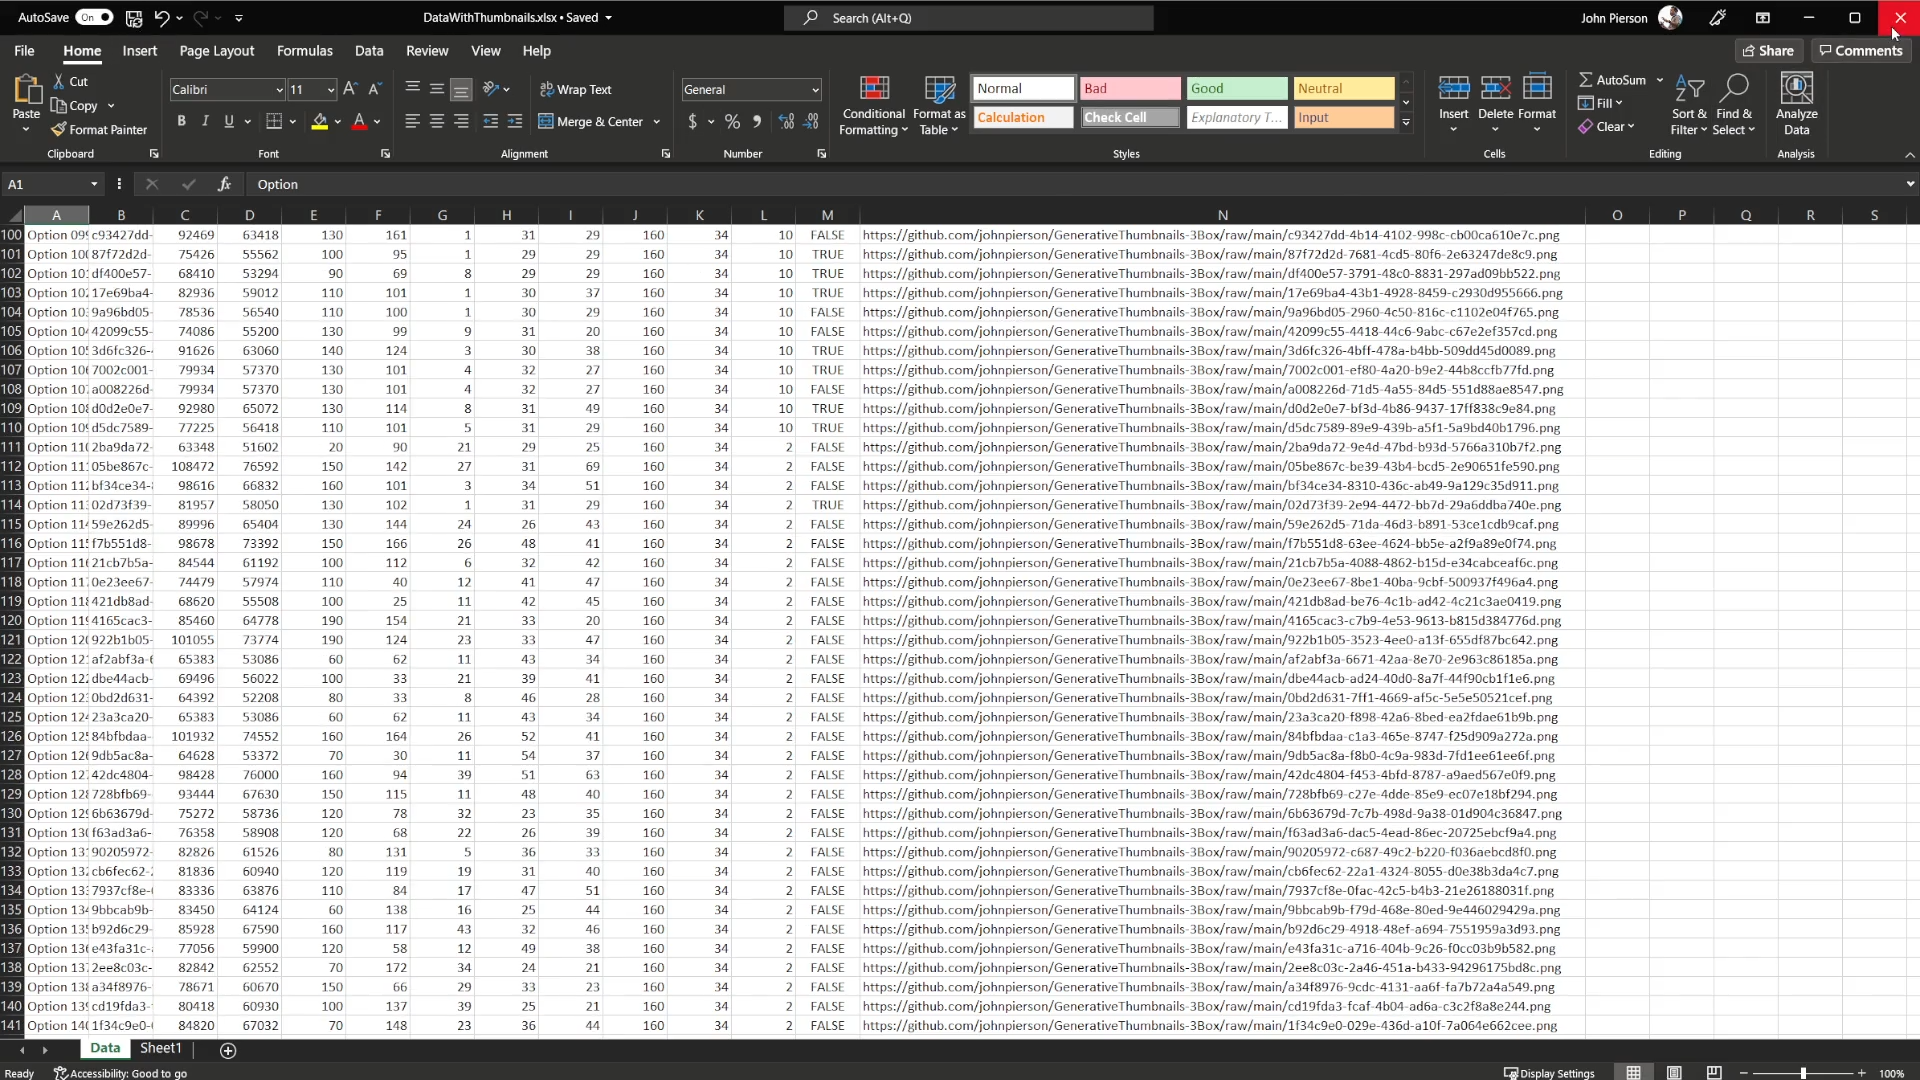
Thumbnail Column in Excel
With our excel file complete, we can import the data into Power for further visualization!
Power BI Visualization
First, we import the excel data.

Importing Excel Data
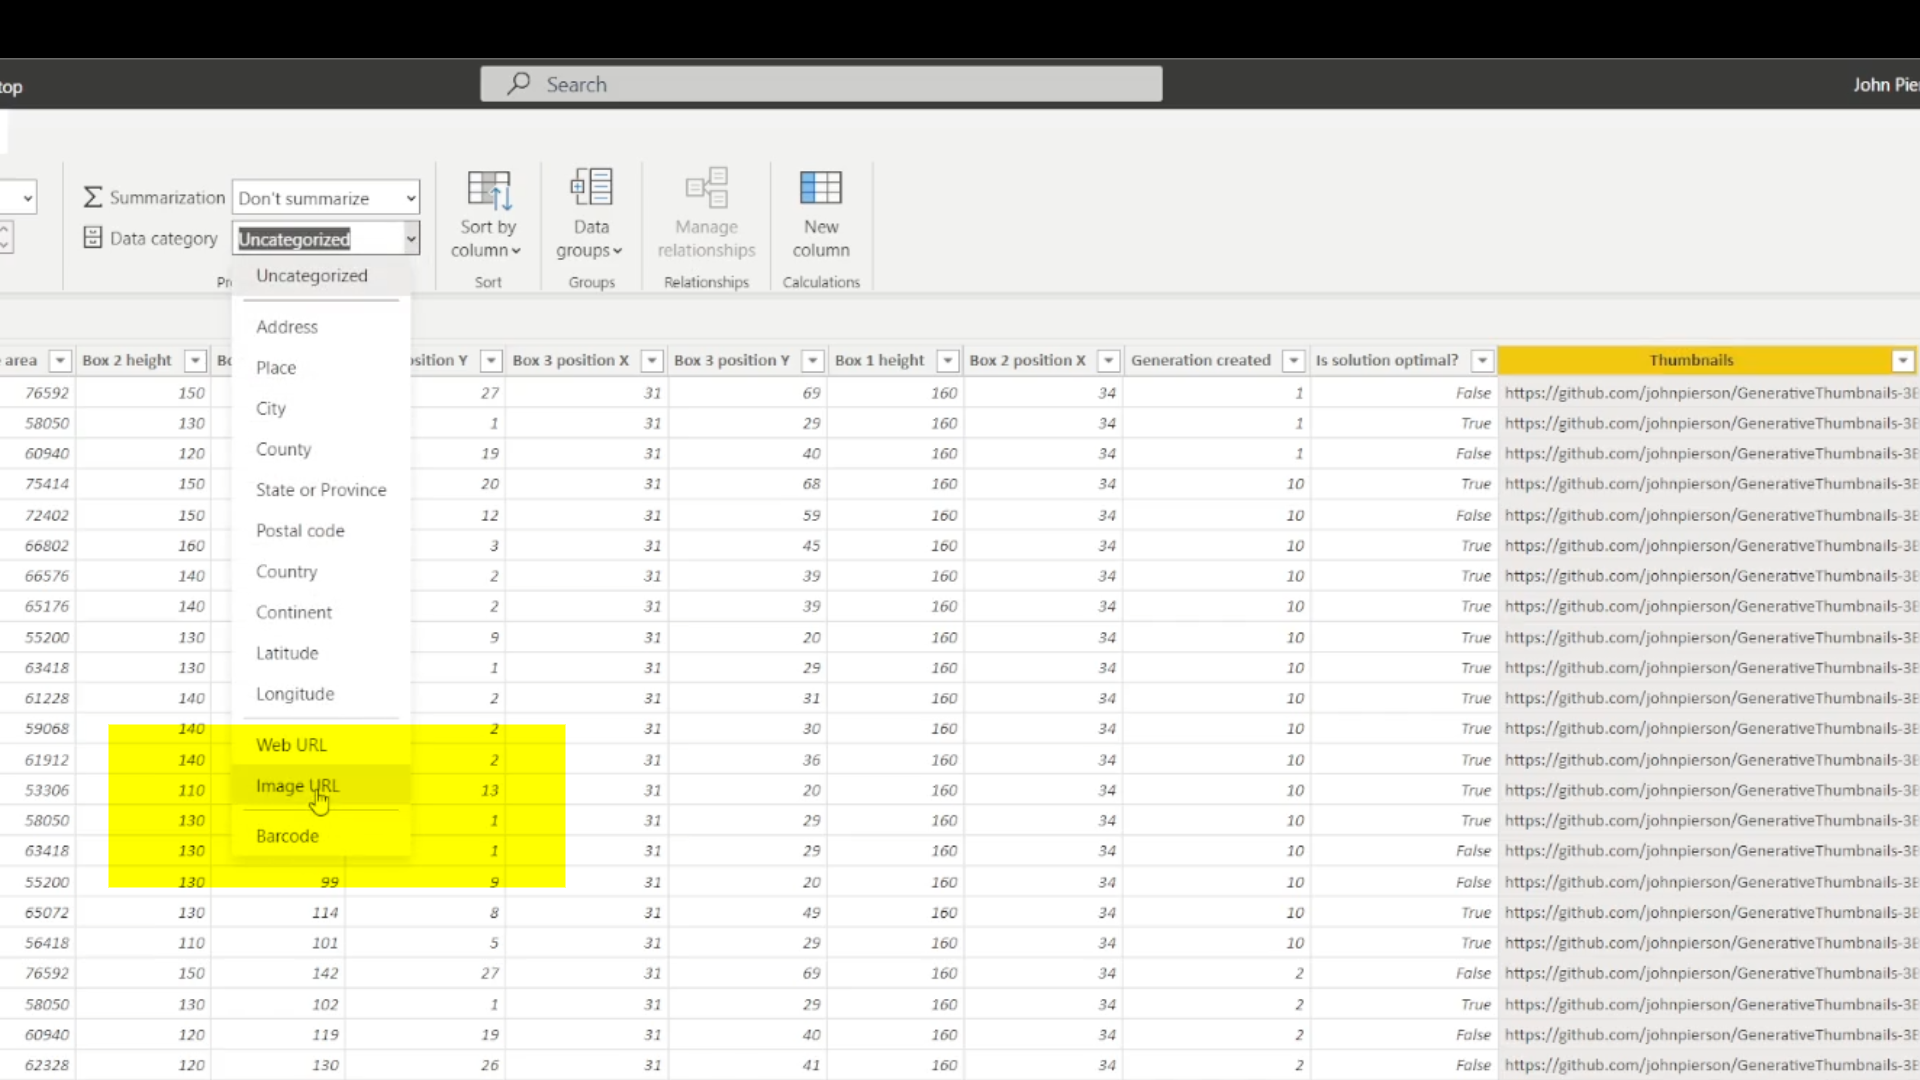
One thing to keep in mind is, the image URLs data type needs modified in order to load.
And we can finally start visualizing the date to truly tell the story of how Generative Design performs optimizations by generation.
