This post serves as a bit of a follow-up to Long’s previous post here, Space Planning in Dynamo with DynaSpace.
Since that original blog post, there have been a few updates to DynaSpace (included in DynaShape) to enable functionality in Generative Design in Revit (GDIR).
As you may know, DynaSpace typically allows the user to manipulate the generated objects on the fly using its own simulation and solving engine. (demonstration of this below).
This interaction is awesome and makes it very simple to rapidly iterating by moving items around in the Dynamo viewport. The downside is, this disabled the workflow from working within GDIR.
To remove this limitation, DynaSpace now has the ability to run optimization silently.
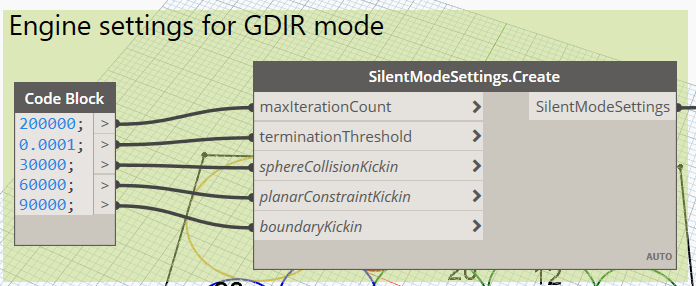
Here is a quick summary of the new SilentModeSettings option.
Description:
Silent Mode is used to run the solver until the final result is reached, without displaying the intermediate result in the form of interactive “animation”. This mode can be used when you are not interested in seeing or interacting with the solving process itself and only need to get the final result as fast as possible.
Inputs:
maxIterationCount:
This is the maximum number of iteration that the DynaSpace solver is allowed to run. The solver usually ends up using fewer iterations than these maximum values. The purpose of this parameter is to prevent the solver from running for too long (and potentially freezing up Dynamo and GDIR). Generally, you can set it to a relatively large number and forget about it. As a rule of thumb, a larger number of bubbles requires more iterations.
terminationThreshold:
When in silent mode, the engine will run iteratively until either the maximum number of iteration is reached, or when all space bubbles (almost) stop moving, whichever happens first. When the bubbles move no more than the small termination threshold value specified here, the engine will consider that the solution is done and it will output the result.
boundaryKickin aka “kickin parameters”:
To achieve a better result, The Silent Mode of DynaSpace actually does not start solving all constraints right away from the beginning (iteration 0). Rather it starts solving the constraints one by one in a specific order. The Kickin parameters allow the user the fine-tune the time (the iteration) at which specific constraints will start to become active. Generally, we have found that an interval of 10000-30000 iterations between the kick-ins is suitable.
NOTE: Since DynaSpace runs optimization internally, we are going to use GDIR to simply create a number of iterations to parse.
In the previous post, Long summed up all of the core logic of DynaSpace, so feel free to take a look at his post to break down that logic. In the rest of this post, we are going to observe the Revit+GDIR specific logic.
Selection
In order to perform space layout strategies, we need to get a boundary. For this example, we will be interacting with Revit directly and Generative Design.

Isolated Room Selection for Generative Design
With the room selected we extract the curves in Dynamo.

With DynaSpace, we will be working with the outermost boundary of the room.
Inputs for GDIR
In addition to the room selection, we need to supply GDIR with an integer slider for the random seed for DynaSpace. As mentioned previously, DynaSpace does its own optimization internally, so we are using GDIR to create a few iterations.

seed input for GDIR to allow DynaSpace to iterate through
Outputs for GDIR
Even though we are using DynaSpace for the optimization and GDIR for randomization, we still need criteria to judge the designs by. The point of this exercise is not to generate a ton of options to parse manually but to parse results intelligently with data given to us from DynaSpace.

Space Adjacency Score set as output to get results from GDIR
Visualizing Results in Dynamo/GDIR
In order to see our results, we need to be specific over which geometry we want to see and how would like to preview it.
In order to visualize the space diagrams we generate colors per department, tag the spaces with text and color code.

The visualization portion of the graph
- Build a custom dictionary with space names and distinct colors. (useful for later retrieval of colors)
- Generate tags centered on each space bubble with 3d text*.
- Visualize space bubbles as distinct colors. (The colors are retrieved from a custom dictionary)
- Visualize Adjacency lines (connections between spaces)
- Note: this is optional. In addition to the numerical results, we can build additional geometries. Even something like a parametric smiley face* that responds based on how “good” the layout is.
*(Available on the Generative Design Visualizer 3000™ package on the package manager)
Creating a Study in Generative Design
Within the create study dialogue we are able to select our source room and specify how many iterations to create. (To reiterate, DynaSpace performs optimization so we will not be using the “optimization” option in GDIR)

fulfilling inputs
After generating options, we can explore the outcomes directly in Generative Design for Revit.

Exploring Outcomes
Creating Revit Elements From Study
In addition to exploring our outcomes in GDIR, we are able to create real Revit elements to represent the results.
Specifically in this graph, we do the following:
- Place “Space Bubble” planning families.
- Set the space name, department, and radius.
- Observe the labeled results (with 3d text in the family)
- (Optional) Create view filters to color-code the space planning bubbles.
Generating Revit Elements
Here are all the sample files for this post:
DynaSpace+GDIR_ApartmentLayout_Revit2021.zip
In the next post, we will cover extracting program data from Revit models and generating a space layout with a program with more departments and spaces. 😁