Introduction
In a previous post, we discussed how to Convert an Existing Dynamo Graph to Work With Dynamo Player. This involved modifying nodes to be used as inputs and creating output (results), for user feedback. In this post, we will expand on this workflow further, by converting that same Dynamo graph to work with Generative Design. With Revit 2023’s new Dynamo Player enhancements, we have seen Dynamo player take on a Generative Design look and feel. This is awesome because the UX is very similar and modifying a Dynamo Player graph to work with Generative Design is relatively simple.
Why use this graph in Generative Design when it works just fine in Dynamo Player?
While our initial graph worked great for randomization workflow in Dynamo player. That is all it will ever be, random. By taking this graph a few steps further, we can start to inform our designs and truly augment the end-users workflow. This is achieved by adding additional logic and data. In our case, this will end up being a coverage area. But this can be a variety of targets such as cost, material sizing, and more.
In addition to optimizing for this criteria, with Generative Design we aren’t “committed” to the change in Revit until we have compared a few designs. This is a great feature to have and allows you to truly explore other options.
Utilize Gate Nodes to Prevent Early Element Creation
In Dynamo Player, a Dynamo graph will create elements upon pressing “run”. With Generative Design, we are working to optimize or randomize a solution by running it several times. This means we do not want elements to get created on every run. This is where the Gate node comes into play.

Data.Gate used to block element creation
Marking the Graph as a Generative Design Graph
With Dynamo 2.12 and up, we have access to a new extension called “Graph Status”. Graph status allows us to mark files for specific use-cases and enables a process called linting. To learn more about this, check out the blog post here, Dynamo Core Release 2.12. With graph status, we can simply mark the graph as a Generative Design graph and the extension will help us with additional conversion. (Note: this process is covered thoroughly in the video at the bottom of this post).
 Opening Graph Status |
 Marking for use in Generative Design |
Utilize Remember Nodes to Cache Geometry
Generative Design is unique in the sense that it runs several instances of Dynamo in the background, (Dynamo Core Runtime). In order to do this, we need to cache geometry from the Revit model to be handed off to these external Dynamo instances. This is achieved through remember nodes. Luckily, the Graph Status extension above suggests where to place these for us.

Nodes that need cached
Implement a Fitness Function
Unlike Dynamo Player, Generative Design requires outputs. The data that feeds into our outputs is referred to as a fitness function. With Generative Design working to optimize or randomize our workflow, it requires data to work on this optimization. This is where our fitness function comes into play. In this example, we are going to use the percentage of the surface that is covered with planting.
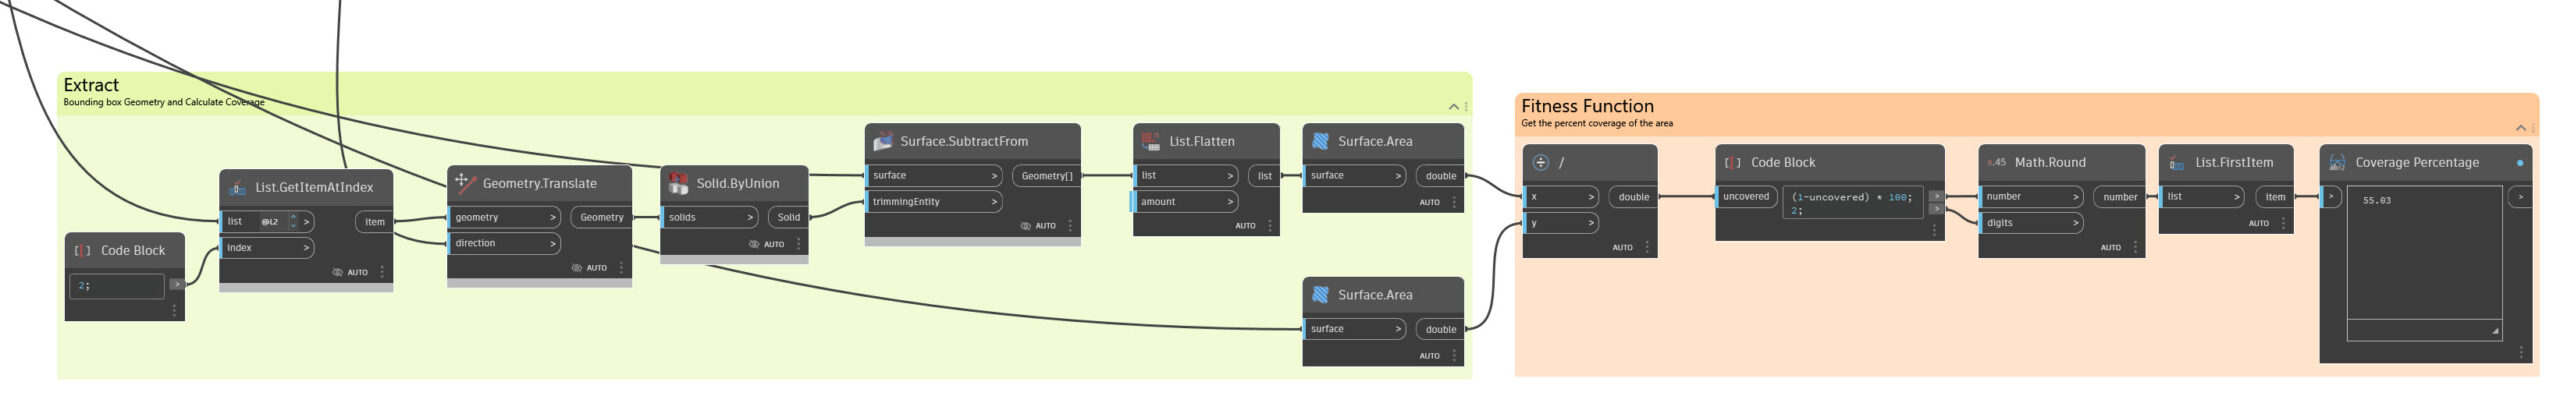
Complete Fitness Function (note: the video covers this in-depth)
Graph Overview
With the above essential steps, we are able to convert the existing Dynamo Player graph for use in Generative Design. For reference, the completed graph is below with annotations.

- Inputs
- Remember Nodes to Cache Geometry
- Dictionary to Store Values
- Getting Values from Dictionary base on Generative Design Results
- Fitness Function to Optimize Against
Keep in mind, that the above is purely an overview of the process, in the video below we cover this entire conversion in-depth with narration and logic presented thoroughly.
Video Lesson
Sample Files
Sample files for this post can be found here, Converting a Dynamo Player Graph for Use in Generative Design