Introduction
The Baháʼí house of worship currently being constructed in the city of Kinshasa, the Democratic Republic of the Congo, is a national house of worship designed for the followers of the Baháʼí faith. The renowned South African architecture firm Wolff Architects conceived the design.
The design is an afro contemporary interpretation of the typical nine-sided Bahai temples, carefully situated on the tropical Kinshasa landscape next to a valley.

Approach rendition of the temple
A prominent feature of the temple is its 3000m² external surface composed of a 30-meter-high dome and undulating upper and lower canopy surfaces, covered in tiles of 9 different colours. The tile pattern was developed by the artist Maja Marx, Wolff Architects and the Baháʼí community of the DRC. The pattern was inspired by textile traditions of the Kuba, Shoowa and Mbuti.

Kuba cloth. From https://venetianred.wordpress.com/tag/shoowa-design/
Why was Dynamo needed?
The large tiling area and time constraints necessitated using Revit’s visual programming software, Dynamo, to produce the required tiling construction drawings. The first step in this process was to flatten the curved surfaces using the Dynamo Unfold package. The flattened surfaces are stitched and then used by the artist to paint the desired pattern in 9 colours. An alternative for flattening the surfaces is to export the surface quads as a .sat file and flatten them in Autodesk Maya or 3Ds max. The image below shows a sample Dynamo graph for flattening the surfaces.

Flattening a surface using the Dynamo unfold package

Surfaces unfolded using the Dynamo unfold package

The stitched unfolded surfaces
Processing the Artwork for Tiling Automation
The received painted pattern is then split into smaller portions and passed into Dynamo as an image file in jpeg format. Due to the irregular shapes of the flattened surfaces, the images receive black backgrounds later removed in Dynamo. Patterns that require black within them can use other colours not contained in the pattern for the background, and square/rectangular images do not need background colours.

The painted pattern received from the artist

A segment of the dome artwork given a black background
It was also crucial to adjust the image pixel proportions relative to the required tile row and column numbers in editing software such as Adobe Photoshop. Adjusting the pixel proportions ensures that the colours are mapped accurately onto the tiles. A Dynamo graph confirms the required image proportions.

A Dynamo graph that outputs the required image scaling proportions

Image scaling graph run in the Dynamo Player

Scaled image to be fed into Dynamo
Mapping the Artwork Colours onto Tiles
In Dynamo, colour samples are picked from the images along the XY axis and mapped onto the tile surfaces. The colours are exported into the Revit project as filled regions. The colours are assigned to the filled regions based on their R values in descending order. In the project environment, the filled regions are called colour 1, colour 2, colour3, etcetera; to automate the filled region selection through Dynamo. See the Dynamo graph below.

Dynamo graph picking the image colours and mapping them onto the tiles. The graph also exports the tiles in their varied colours as filled regions

An image showing a tiling set out drawing for one of the dome segments. The dome drawings were split due to expansion joint requirements. A red Revit detail item family is used to subdivide the tiles into 300 x 300mm mats for ease of installation. The mat numbering is automated using a Dynamo script.
Tile Quantities
Measuring the tile quantities was achieved by passing the non-schedulable read-only filled region area values into a custom project parameter called “Region Area.” The region area parameter values are used as inputs in Revit schedules to sum up, the tile areas per colour for tile purchase orders.

Dynamo graph used to assign the filled region area values to the “Region Area” parameter per view

Construction image showing installed tiles on the dome. Credit: Bahá’í World News Service
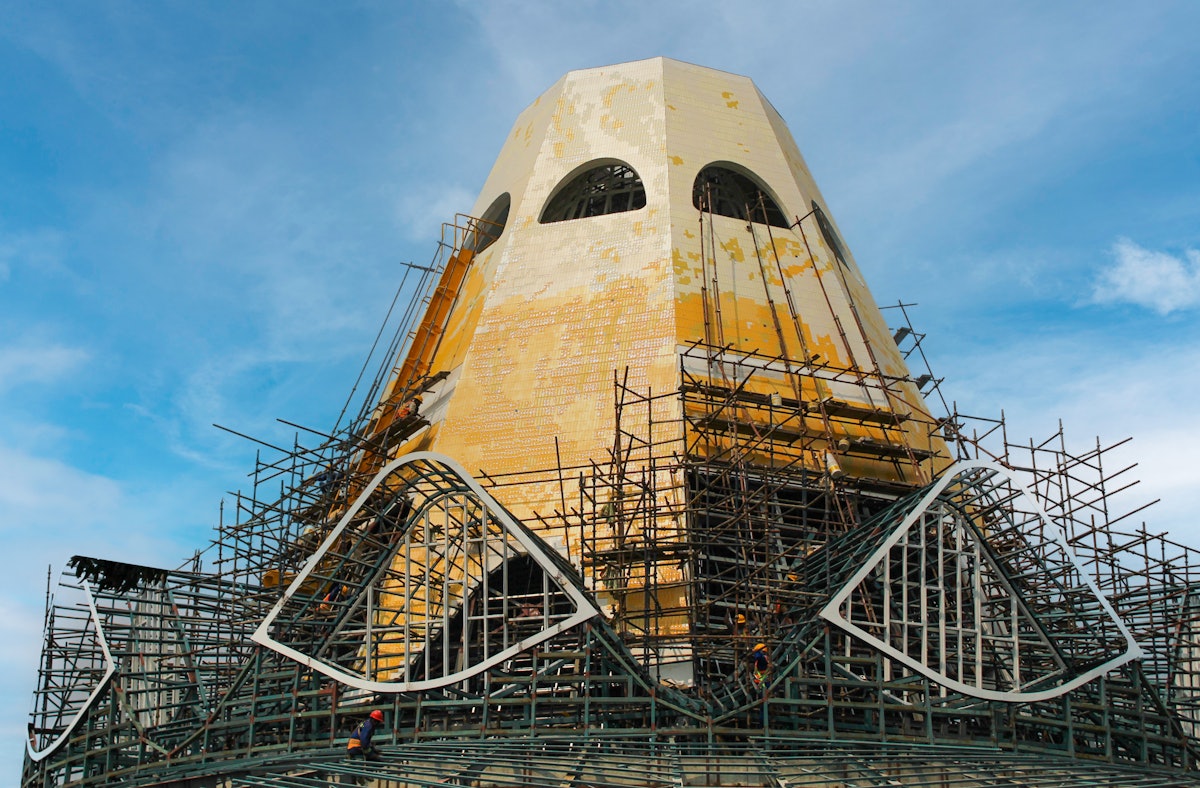
Construction image showing installed tiles on the dome. Credit: Bahá’í World News Service
Download the scripts shown above here Tiling Automation Dynamo Graphs
