Continuing a series of tips I wish everyone knew. In a previous post, find:
[0] Hot Keys
[1] Make Lists †
[2] Access List Items
[3] Node Options
[4] Auto-complete
† Explanation here for the strange name I’ve chosen for the post.
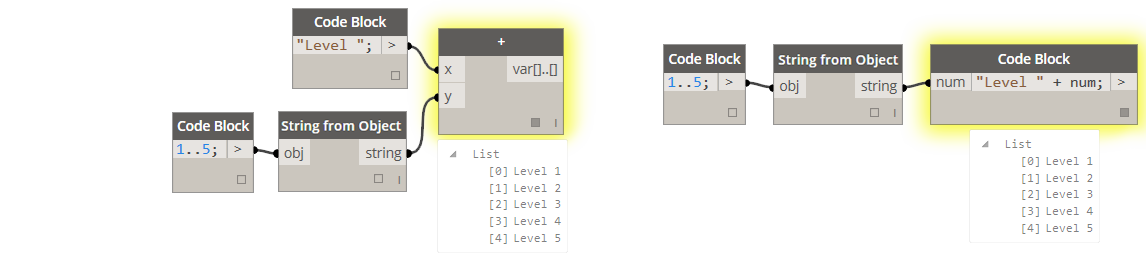
[5] Make Strings
| [0] | Use a String node… Easy! | |
| [1] | Use "double quotes" in a code block. Still easy! |

| [2] | Find the string representation of a data item with String from Object. |

| [3] | Make a string from other strings. Use the + node or the + operator in a code block to concatenate strings. (From Dynamo, see Help/Samples/Core/CoreStrings.) |
[6] Wrap Dynamo Style: Custom Nodes
| [0] | Select the nodes you want to collapse into a Custom node, right-click in the canvas, and choose New Node From Selection. |

| [1] | Give the node a name, a description, and a place in the Dynamo library. (You can make up a new category if you want to.) |

| [2] | Double-click your custom node to peek inside. You’re in a new tab in your Dynamo canvas. | |
| [3] | Edit the text in the Input and Output nodes to read as you would like the input and output ports to read on the custom node. Add or remove input and output nodes as needed. | |
| [4] | Save the custom node while inside the custom node workspace. Accept the default location: C:\Users\Your_Name\AppData\Roaming\Dynamo\0.7\definitions so that Dynamo can find it next time you open the program. Read more on files and folders at: Where Does My Dynamo Live?. | |
| [5] | Use as directed. |

| [6] | Find the custom node in your library in the category you placed it earlier. | |
| [6] | Update custom node properties by right-clicking. Choose “Edit Custom Node Properties…“ | |
| [6] | Try it yourself: SmileyFace.dyn |
[7] Organize With Code Blocks
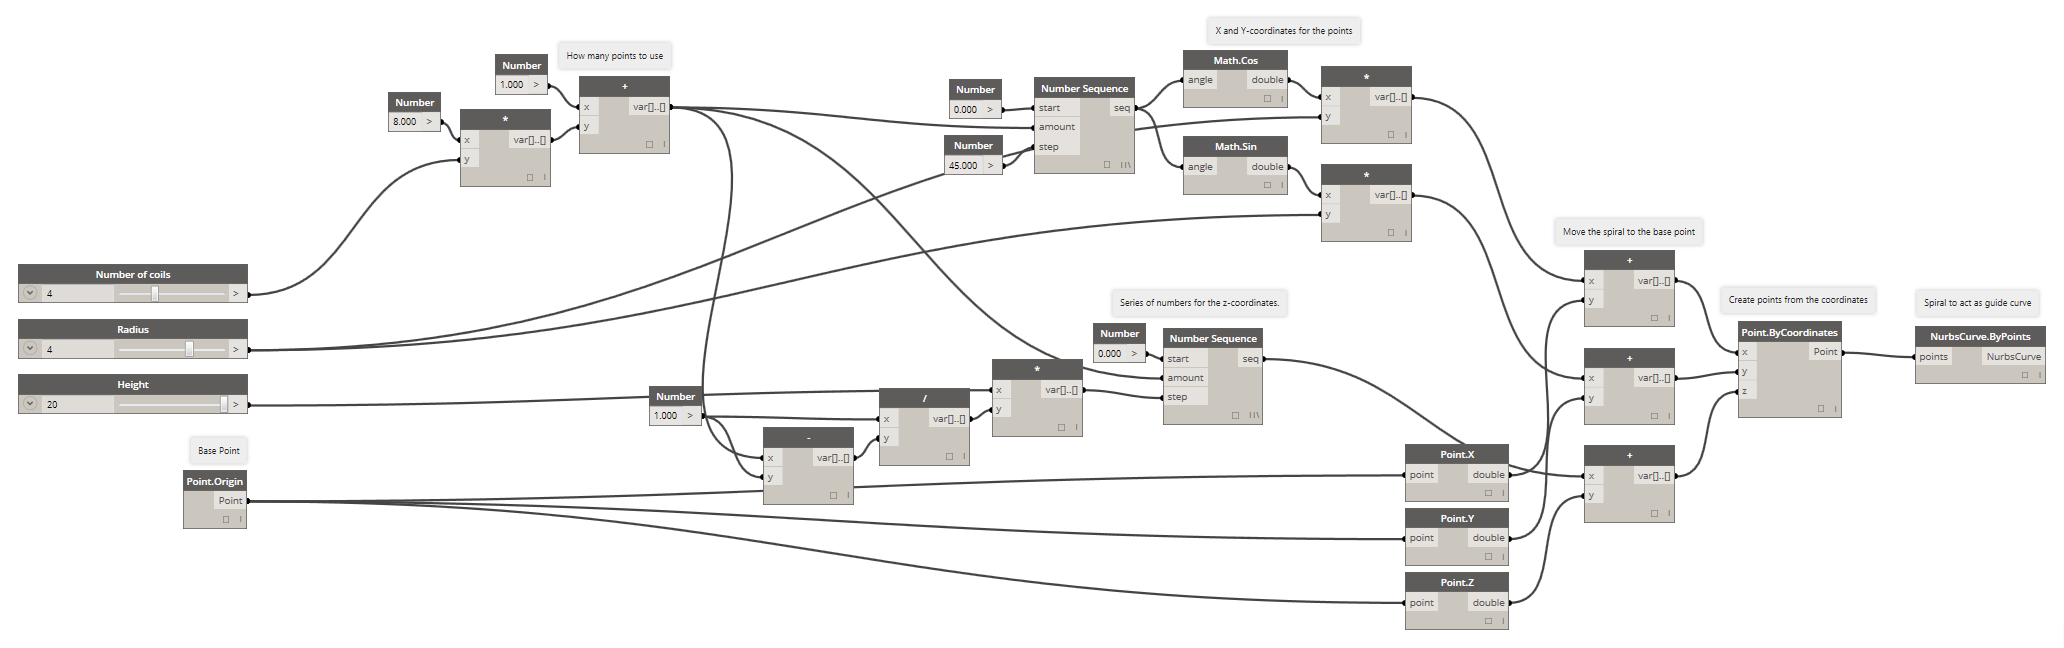
| [0] | This graph makes a spiral line using only nodes, which are organized in clusters. Inputs are number of coils, radius, height, and base point. Though completely acceptable, you have other options too with Dynamo. (Click each image for higher resolution. Example file here: coil.dyn.) |
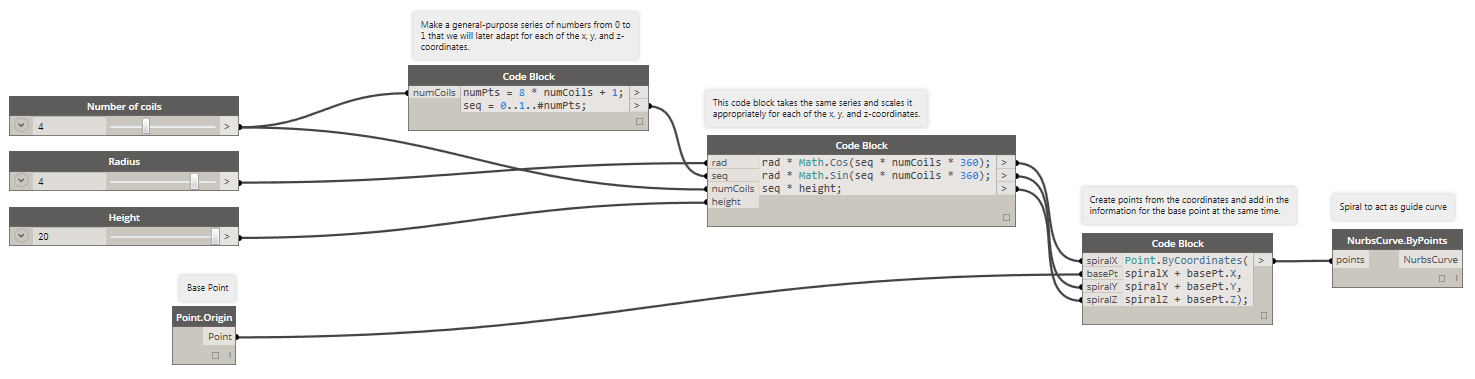
| [1] | This graph makes the same spiral curve but uses code blocks for all the math including the very handy series syntax. This graph is easier to “read” and most likely easier to edit later on. |

| [2] | Taking things a step further, this graph uses code blocks to contain full ideas, like paragraphs are to sentences. As an example, the second to last node is a code block that translates all the information for x, y, and z-coordinates into geometric points. For more on how, see an earlier post on how to call other nodes from a code block. |
| [3] | Of course, you can contain an entire graph in a single code block too. Comments following the “//” symbols help communicate to the user what the code is intended to do. |

[8] Functions in a Code Block
| [0] | You knew I had to mention this. Once you’re fully addicted to code blocks, you can define your own functions too. That spiral above…? Check this out: (coilByFunction.dyn) |

| [1] | The magic words are def and return. |
|
| [2] | You’ll also need to name your function so you can refer to it elsewhere, tell it what its inputs are, and give it a hug with curly braces. Here’s the 1:1. |
