Artificial intelligence is reshaping how design teams in the Architecture, Engineering, and Construction (AEC) industry approach early-phase project documentation. At the Dynamo Hackathon in Nashville, we joined peers from across the industry to experiment with AI capabilities embedded directly inside Dynamo. The challenge? Explore use cases where structured building data could be paired with AI to solve real-world engineering problems.
Our team pitched and then delivered a workflow that transforms early-phase Revit energy models into schematic design (SD) narratives with just the push of a button.
A Unique Scenario: From Massing Model to Narrative
We focused on a common but time-intensive requirement: producing design narratives. Every engineering trade is asked to provide these narratives early in design. Traditionally, these documents take hours to write, require careful cross-checking, and often vary in quality or style between teams.
Instead of starting from scratch, we leveraged Revit’s analytical energy model. Even a simple massing form creates a data-rich model containing spatial information, loads, and system assumptions. Using Dynamo, we gathered this data and paired it with prompt instructions and example narratives. AI then converted the structured data into a draft SD narrative, one that could be exported directly into Word for sharing with project teams and owners.
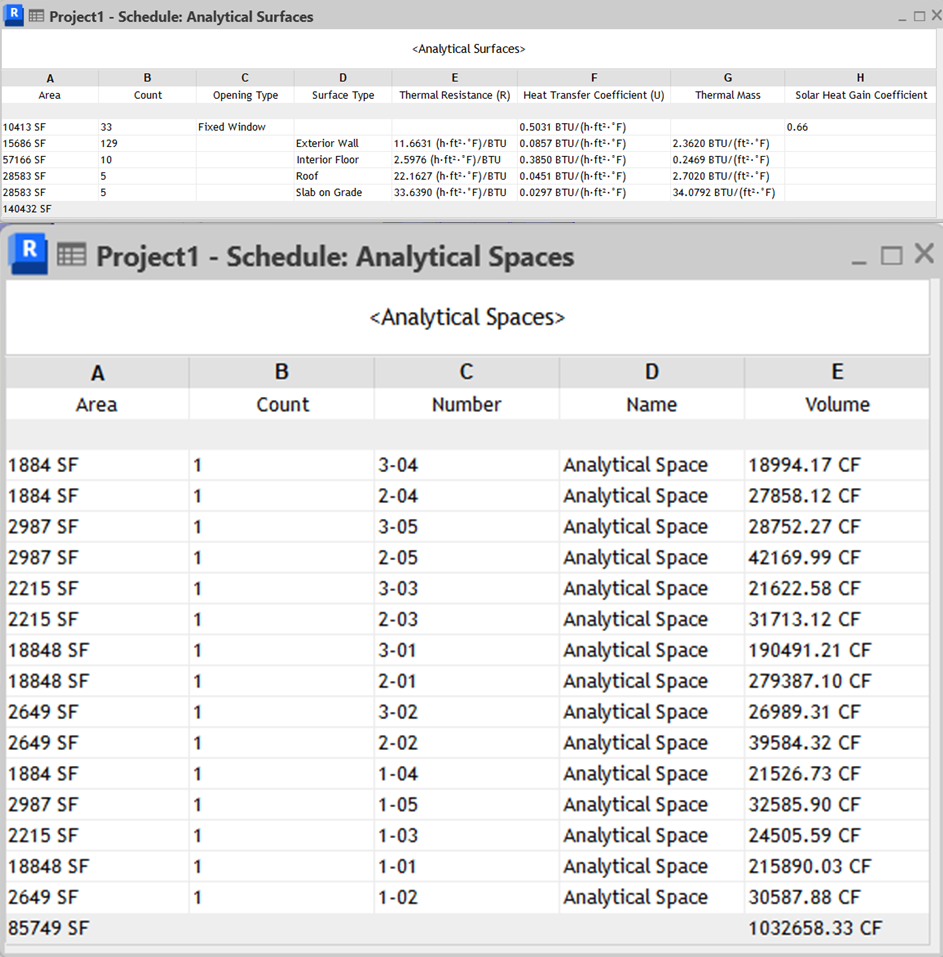
For reference, here is a snippet of the data in Revit that went into the design narrative:
Why It Matters: Push-Button Narratives
Most engineers aren’t interested in prompting AI directly. Running the workflow through Dynamo Player meant no typing instructions, no trial and error. They just click one button to generate a narrative.
The output? A professional SD narrative aligned with the energy model data. Owners gain transparency into early design assumptions, while engineers save time, utilize their Revit data, and improve consistency across projects.
For a firm like IMEG, which executes roughly 2,000 projects per year, the return on investment is significant. Writing narratives takes about 4 hours per trade. At 3 trades per project and a $50/hour billable rate, this equates to over $1 million in potential savings annually, all while standardizing deliverables across teams.
Methodology: Building the Graph and Engineering the Prompt
To make the AI agent truly useful, we had to teach it how to “think like an engineer.” The Dynamo graph we built used the new Dynamo Agentic nodes to interact with the Revit model and extract relevant analytical data. The core prompt we used was:
“You are a Dynamo, Revit, and BIM engineer and expert. Please use the active Revit model to find the following information. Collect the elements in the model of the Analytical Spaces category. Then use Standard nodes to collect the following parameters and provide them in lists as well as sum them up. Properties: Area, Peak Heating Load, Peak Cooling Load, Peak Latent Cooling Load, Outdoor Airflow. Create a list by Reference Level of the building.”
This prompt evolved through several iterations. We discovered that using user-readable names, the ones shown in Revit’s Properties Palette was more effective than relying on internal API terminology. In some cases, we had to hint the Revit API directly to access certain parameters, especially when the AI struggled to interpret ambiguous or technical terms.
We also experimented with different ways of grouping and summarizing the data. For example, organizing by “Reference Level” helped contextualize the narrative and made the output more intuitive for design teams.
Here’s a snippet of the graph showing the data extraction and prompt construction:
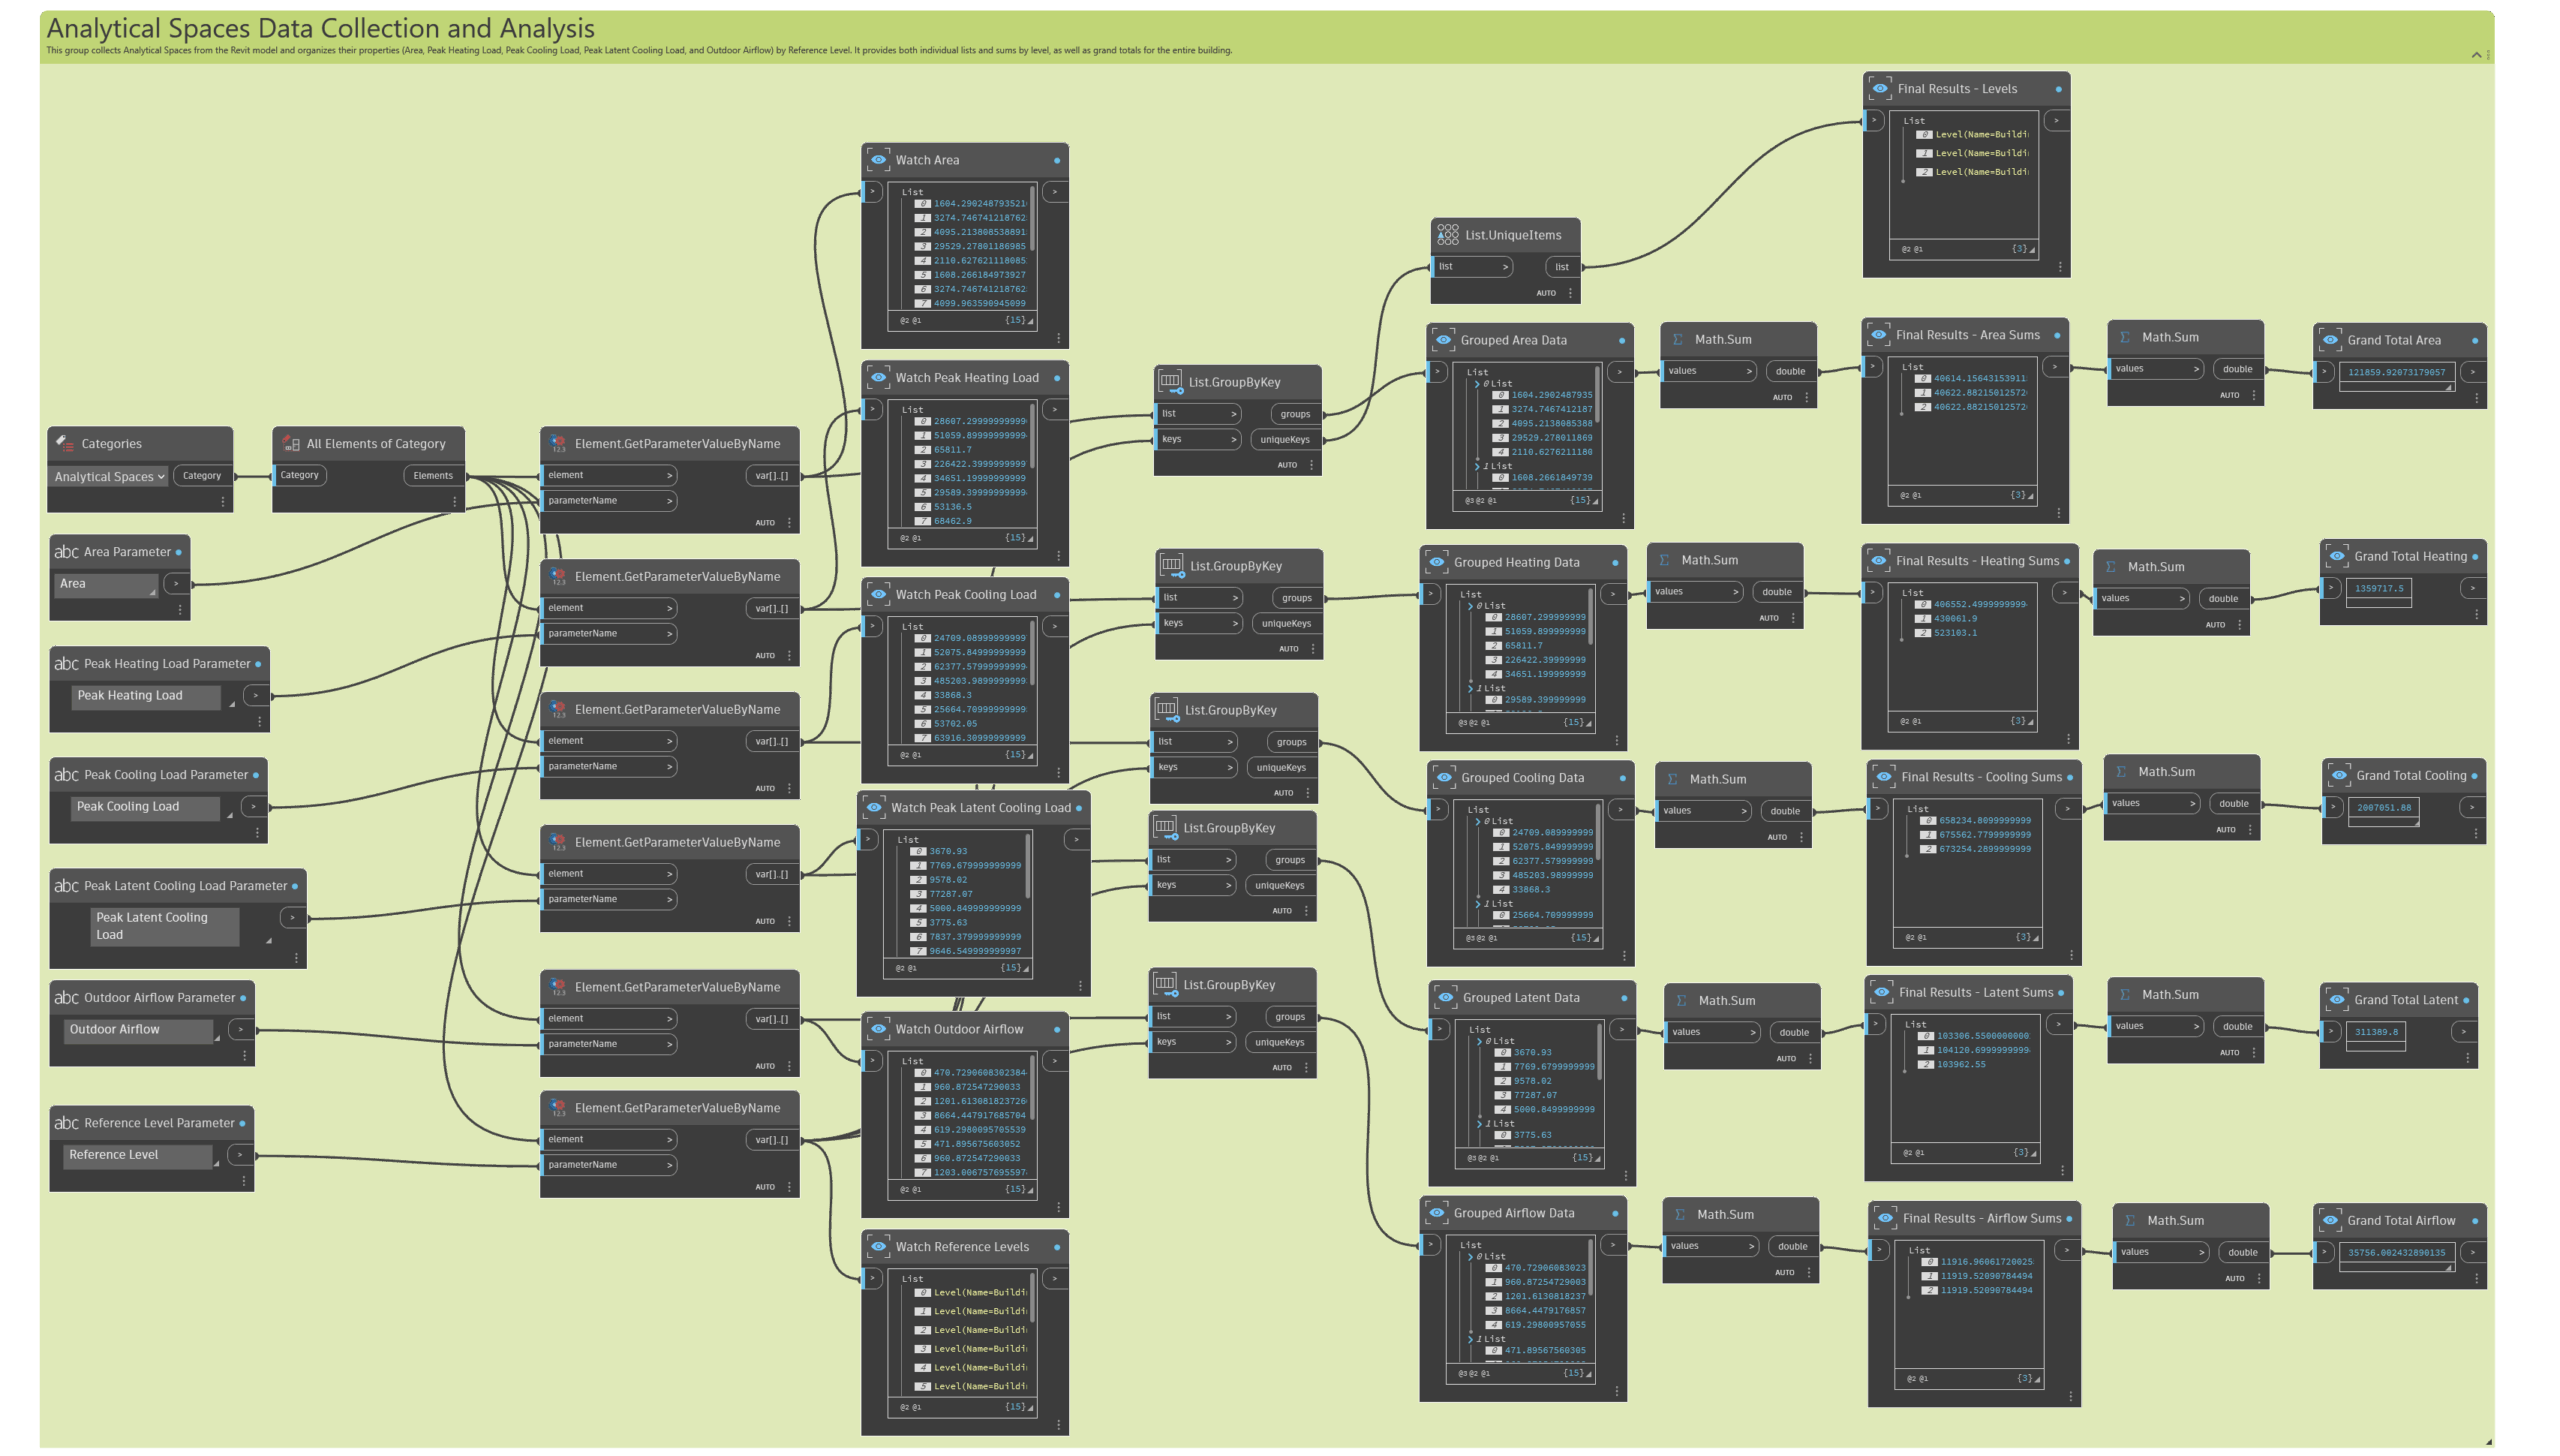
This iterative process helped us refine the agent’s understanding and improve the quality of the generated narratives. Each tweak to the prompt or graph structure brought us closer to a reliable, repeatable workflow.
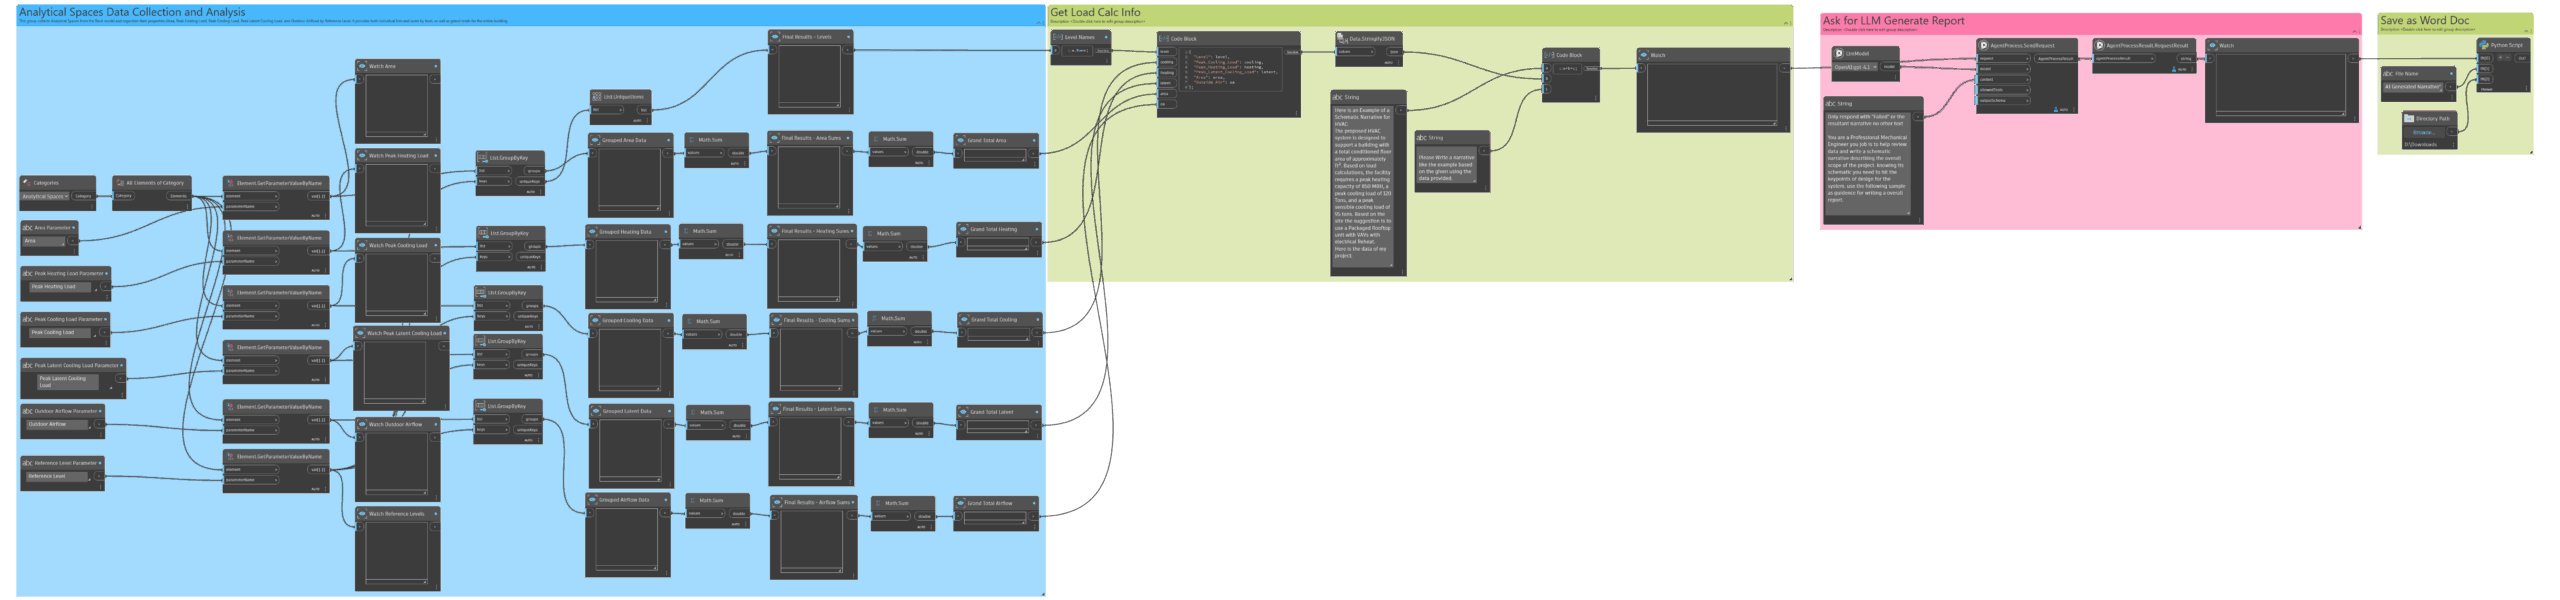
Once we had a graph doing data extraction, we were able to pair it with the LLM (Large Language Model) nodes to call OpenAI and Claude to ask the AI to take a sample narrative and prompt it to write a narrative using the information we feed in via the graph output.
We found some issues and variations in prompting the AI to output something usable. We settled on taking the Revit data as a dictionary string in a JSON format and connecting that with the following prompt sample:
“Here is an Example of a Schematic Narrative for HVAC:
The proposed HVAC system is designed to support a building with a total conditioned floor area of approximately ft². Based on load calculations, the facility requires a peak heating capacity of 850 MBH, a peak cooling load of 120 Tons, and a peak sensible cooling load of 95 tons. Based on the site the suggestion is to use a Packaged Rooftop unit with VAVs with electrical Reheat.
Here is the data of my project: We gave the “Stringyfied” data that we had previously extracted.
Please Write a narrative like the example based on the given using the data provided.”
It quickly gave us an output file on the local PC with the following text:
“The proposed HVAC system is designed to serve a facility with a total conditioned floor area of approximately 121,860 ft², distributed across three floors (Building 1 Level 1, Level 2, and Level 3). Based on schematic load calculations, the building requires a peak heating capacity of approximately 1,359 MBH and a peak total cooling load of around 167 tons, with a peak latent cooling load of 26 tons. The ventilation design accommodates an outside air requirement of about 35,756 CFM to meet both indoor air quality and code requirements. The schematic recommendation is to utilize packaged rooftop units equipped with variable air volume (VAV) terminal units featuring electrical reheat. This approach allows for efficient load management across diverse zones and optimal energy utilization while maintaining occupant comfort throughout the building.”
We did find that providing context and boundaries around roles and rules helped. For example, we used:
“Only respond with “Failed” or the resultant narrative no other text. You are a Professional Mechanical Engineer you job is to help review data and write a schematic narrative describing the overall scope of the project. Knowing its schematic, you need to hit the key points of design for the system. use the following sample as guidance for writing an overall report.”
We noticed that otherwise the LLM only being given one interaction can sometimes provide a lot of extra info we would have to edit out of the report.
Lastly, we wrote a simple save to .txt file python command that saved the extension as a .doc so that word would auto open and interpret the results as a document.
import os
body_text = IN[0]
file_name = IN[1]
folder_path = IN[2]
# Clean up the file name (remove any quotes or extra spaces)
file_name = file_name.strip().strip('"').strip("'")
# Ensure .doc extension
if not file_name.lower().endswith(".doc"):
    file_name += ".doc"
out_path = os.path.join(folder_path, file_name)
# Write the text
with open(out_path, 'w', encoding='utf-8') as f:
    f.write(body_text)
OUT = out_path
Then we set up Dynamo Player inputs and also were able to run it with Dynamo Player. We thought this is an easier way to Deploy to other Staff in the organization who may not be Dynamo experts!

For firms like Osborn Engineering with high volume of Sports Facilities Designs, Iteration of shapes and sizes of building scope in schematic design is challenging. Removing the team from providing rapid design feedback at early stages. With a tool like this leveraging AI to help solve design problems and limit time writing reports will help on larger scale projects.
Results: A New Way to Deliver Value
By the end of the hackathon, we achieved a working proof of concept:
- Extracted energy model data directly from Revit
- Pushed it through Dynamo’s AI nodes
- Generated an SD narrative in minutes
- Exported the output to a Word document
The result was exactly what we were aiming for. We got a clear, client-facing narrative aligned with Revit model data, executed with a click from Dynamo Player.
Looking Ahead: Version 2 and Beyond
We left Nashville excited about what comes next. Future iterations will:
- Refine prompts for even higher-quality outputs
- Automate Word exports with company branding and standardized formatting
- Extend the workflow to other repetitive documentation tasks like submittals and reports
- Integrate with Dynamo as a Service (DaaS) in Autodesk Forma
This hackathon proved that AI inside Dynamo isn’t just an experiment, it’s actually a glimpse at how documentation-heavy workflows in the AEC industry can be automated, standardized, and improved at scale.
Takeaways
The project highlighted more than just technical feasibility. It showed how AI and structured design data can be combined to create immediate business value. We also saw firsthand how Autodesk is democratizing access to AI tools, making advanced workflows accessible to both experts and beginners.
The future isn’t just about new features in Dynamo or Revit, it’s about engineers working smarter, not harder, and using these tools in creative new ways. As interoperability and automation continue to expand, the barriers between design data and client deliverables will keep shrinking. The possibilities are endless, and this is only the beginning.
Meet the Team