Planning for Social Distancing
As we’ve learned more about the COVID-19 virus and as public health guidelines evolve, we looked for ways that computational methods can help designers plan for safer spaces. In this post, part 1, we’ll look at how Dynamo can work with Revit to help determine office or school occupancy plans that comply with social distancing guidelines. This post will look at a single objective: find a seating arrangement that maximizes occupancy for a floor plate given a minimum safe separation distance between people.

This post presents a couple of versions of a Dynamo script to help you study office or school layouts given a minimum safe separation for social distancing. As presented here, the scripts solve for a single objective: finding the maximum number of occupants for a given furniture layout. Consider this a “simple” example that ignores other factors that designers must also balance.
Real-life situations are more complex—the occupancy of some seats might be non-negotiable or some seats might need to be avoided because they’re near return-air vents. Most significantly, some seats can be moved to increase distances while others may be fixed. We’ll save the discussion of multi-objective optimization for the next post where we’ll use the more powerful Revit Generative Design feature. In the meantime, take these scripts as a guide or a starting point as you find ways to adapt the built environment to life during a pandemic.
Since these scripts are relatively straight-forward, they can be deployed quickly with Dynamo Player or can be ripped apart and reassembled with your own additions to fit your circumstances.

Download a copy of the files here and read on for details.
 |
 |
COVID occupancy by instance.dyn | ||
 |
 |
COVID occupancy by keywords.dyn |
Inputs and Outputs
The script is designed to require as few explicit user inputs as possible: which elements, what’s the minimum required separation, and how to view the results.

Element Selection
It’s not by accident that every Revit 101 course includes how to select sets of items in the very first hour of instruction; it’s a big part of every workflow, and there are enough special circumstances in most projects to make selecting elements an art form. Likewise, this part is the hardest to usefully automate for a general-purpose script. The attached scripts present two options.
| COVID occupancy by instance.dyn | ||
| Choose a single instance of a seat to select all instances of that family type in the active view. | ||
| Pros: | Cons: | |
|
|
|
| COVID occupancy by keywords.dyn | ||
| Enter keywords to select all instances in the active view in the Furniture category whose family name or family type name contains those words. Use commas to separate multiple keywords. | ||
| Pros: | Cons: | |
|
|
|
Minimum Separation
The minimum separation is what these scripts are all about! Enter this number in your project units, perhaps 1500 (mm) or 6 (ft). The algorithm will calculate a result based on the tightest-possible packing with this minimum separation (details below). Consider the separation distance to be a variable input parameter. Testing slightly larger values, perhaps 5-15% greater than the legal minimum limit, may help you discover better arrangements.

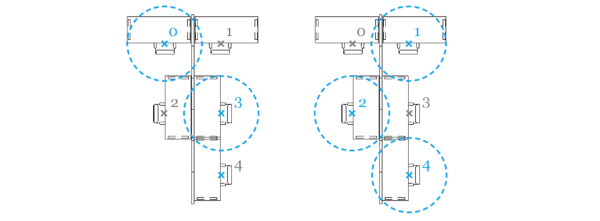
Try using a larger minimum separation than the legal minimum because you may discover better arrangements. The result on the left used the exact legal minimum separation (rlegal = half the minimum separation) versus using a slightly larger radius on the right (ranalysis > rlegal). Both arrangements are valid, but the answer shown on the right has just as many occupied seats with greater average separation.
Implicit Inputs
These scripts also use information derived from the active Revit view that doesn’t need to be set explicitly by the user. The active view is used to limit element selection to those that are visible, to select relevant room elements, and to optionally override element color to display results.
Viewing the Results
The ultimate output of the algorithm is a list of seats and whether they can be occupied with social distancing guidelines. In addition to global figures like % occupancy and number of occupied seats, there are two options for how to format the per-seat information.
- To quickly see the result in Revit, turn on the option to “override element color.” This will color seats that should be occupied green and those that shouldn’t red. You can reset this manually in Revit or use the Undo command to undo all the changes en masse.
- To be more properly BIM-y, create a Yes/No instance parameter for the seat family and chose the option to update that parameter with the True/False results. More on that below.
Many other options for representing results are possible, and I’ve listed some ideas below.
The Algorithm
Once the seat elements are identified, each is associated with a location point that represents the location of a human occupying that seat. Real humans don’t have zero width, but the distance between these points gives a proper center-to-center distance between people. The instance location point may not be modeled in the center of the seat geometry, so the location point used in the algorithm is derived from the element bounding box.

A representative location point is found for each seat that will be used as a key value for calculations.
The seats are divided into groups using their locations, with the intent that each group can be treated as an isolated optimization problem. Since rooms are usually divided by walls that block airflow, seats are first grouped by the rooms that contain them. Room elements are not required for this step, but if they’re present, they’ll be used.

Rooms are used to divide the seats into groups that are isolated optimization problems.
A seat group may be divided into smaller groups if there are clusters of seats separated by at least the minimum separation distance. If your floor plan includes a large room with banks of seats/desks, those groups will be identified.

Once seats are grouped by room, they are clustered by their relative proximity in smaller groups.
For each group, the next step is to find the arrangement that has the most occupied seats. This part is necessarily iterative, where each new logic loop depends on the results of the previous state. Here’s the gist: to find a valid arrangement, declare a seat occupied, mark any other seats that are too close as vacant, add the next-closest eligible seat as occupied, repeating until all seats are marked one way or the other.

Example of the seat-choosing algorithm working to identify occupiable and non-occupiable seats starting with seat [4].
This group of seats has two unique solutions, and the one with the most occupied seats is chosen as the optimum arrangement.
Ideas for Customization
The scripts are ready to use as-is, though if you’re anything like me you’ll open them up first, poke around a bit, and change some things. Please do! As provided, there are two options for displaying outputs: the classic “override color in view” trick that colors elements in the Revit view and writing a yes/no value to a designated parameter, but you’ll probably have ideas for other ways you’d like to process that information. Choose whichever method works best for your workflow or tweak the scripts to meet your needs. Here are some ideas.
- New inputs
- Limit the scope of the analysis to a specific room.
- In the script, rather than operating on all the seats in the view, filter by a selected room.
- Change how seats are selected to allow for must-be-occupied or must-be-vacant seats.
- Limit the scope of the analysis to a specific room.
- New outputs
- Place markers at each occupied seat for a presentable planning view.
- Be sure to translate the seat location points from the XY plane to the elevation of the level so that they appear in the Revit view.
- Place markers at each occupied seat for a presentable planning view.
- Extend the workflow
- Create a schedulable yes/no parameter per seat to track occupancy.
- Create a shared instance parameter for the Furniture category.
- Choose the option in the script to write a true/false value to that parameter.
- Create a view filter in Revit to display occupied seats instead of the override color option.
- Assign occupiable seats to a list of people.
- Map a list of names from an Excel spreadsheet or other source to the seats that should be occupied.
- Create a schedulable yes/no parameter per seat to track occupancy.
Up Next
We’ve also been working on extending the analyses in this workflow to incorporate additional objectives beyond spacial proximity so that we can run multi-objective optimizations with Generative Design in Revit. Stay tuned for scripts and examples that include finding office occupancy patterns that avoid congestion and placing people face-to-face.
Let us know which ways you end up customizing these scripts and what additional objectives you’d like to analyze, and we’ll try to work those improvements into the next versions.
Thanks!
Special thanks for ideas and for help reviewing the scripts for this post belongs to John Apicella, Kelsey Baker, Rebecca Sultz, Mai Wu, and Julie Zink of Apicella + Bunton Architects and Mark Bruce of Autodesk’s own facilities department.