When starting a new project, the first thing to look for is usually a fair representation of the project’s environment. There are many ways to do so already but they all require using external sources and export/import of information before you have them in your authoring tool. The late Flux.io (RIP) offered a “site extractor” tool that offered a nice workflow but it unfortunately went down. DynaMaps project is an attempt to bring back this experience (and more!) and provide the most straightforward workflow to get site data into Dynamo. It originated at the London Hackathon of april 2019 and is now available on the package manager. Here’s a quick tour of the capabilities of this new tool.
A VIEW EXTENSIONS AND A SET OF NODES
The DynaMaps package contains a view extension found under the “view” tab of Dynamo, and a set of four nodes (so far).

Content of the DynaMaps package
A MAP SERVICE INSIDE DYNAMO
Getting your site data with DynaMaps is very direct. First, you’ll need to open the view extension from the “view” tab:

Where to find the DynaMaps extension
The UI of the view extension is then very similar to that of any common map service online. It actually is one of them: Bing Maps.

The map viewer
You can scroll to zoom and navigate with your mouse, or use the “Address” textbox and click “Take me there” to navigate directly to your location. DynaMaps uses the Nominatim API for geocoding so try and be as precise as possible giving your address.

Navigating to a chosen site
THE WORKFLOWS
The workflows are very straightforward. You only need to place one of the DynaMaps nodes on your canvas and press “Push to Dynamo”. The view extension will then fetch the OpenStreetMap data corresponding to the area shown on the map, and the nodes will output that data directly converted into Dynamo Geometry.
The BuildingFootPrintPolygons node will return the footprints of all buildings in the map viewer as polygons.

Getting building footprints as polygons
The BuildingFootPrintSurfaces will return footprints of all buildings in the map viewer as surfaces, saving you the hassle of sorting inner and outer loops and offering you a very simple way to extrude shapes.
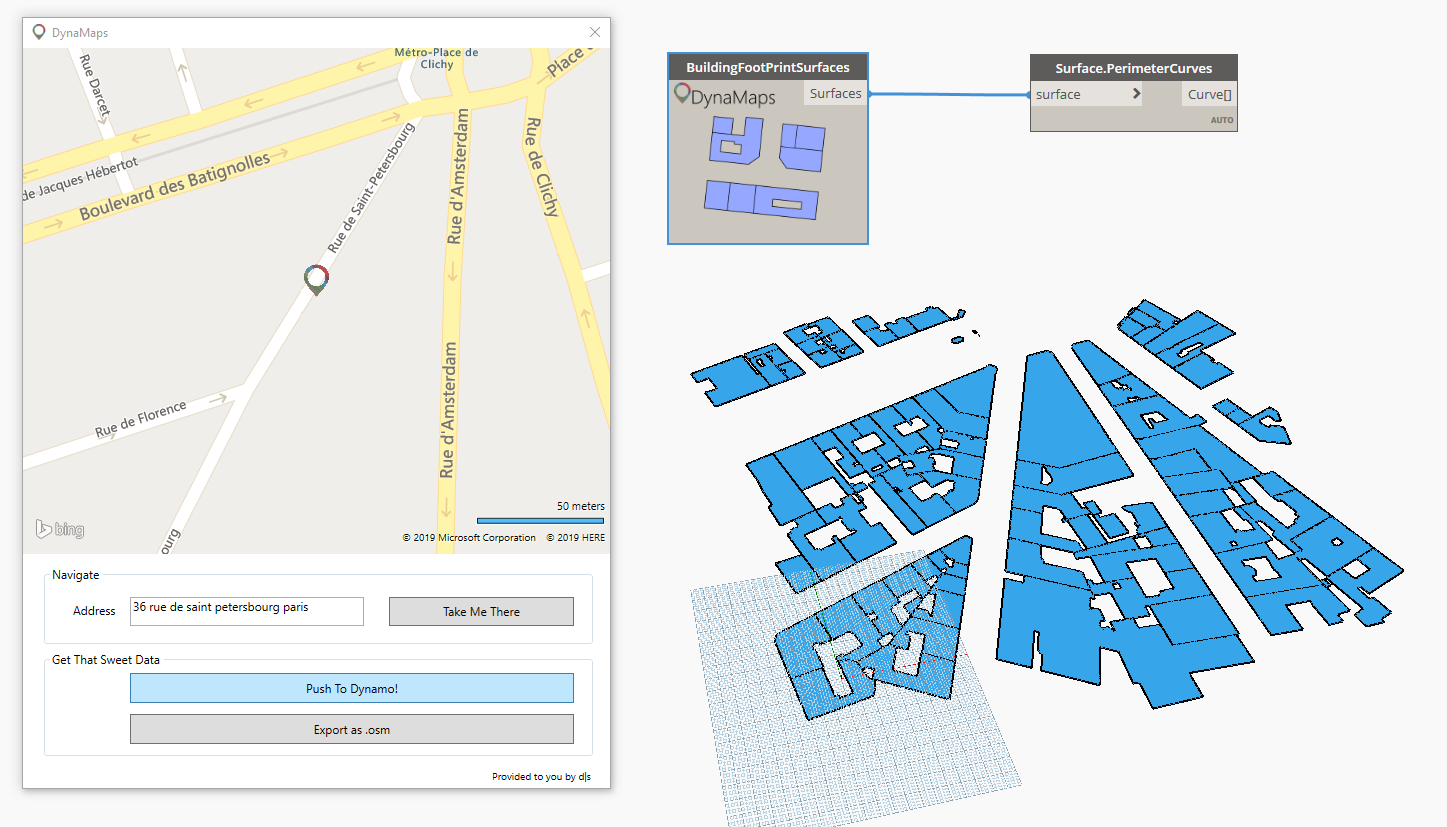
Getting buildings footprint as surfaces
The TopoPoints node uses informations from the Elevation-API . It returns a 10×10 point grid of the area with very accurate elevation data. The resolution of the grid is limited to 10×10 for now because the Elevation-API is not free. If this view extension is successful enough and if there is demand, a system allowing to get your own Elevation-API token and credits will be implemented in DynaMaps. This would allow for greater resolutions when extracting topography data.
The point grids can very easily be turned into Revit Topography:

Getting topography data as a point grid
There is also an easy way to get the topography as a PolySurface in Dynamo. One possible workflow to quickly get some site geometry to start designing with is to project the building footprints onto the topo PolySurface as shown below:

Topo Polysurface with projected Footprint workflow
If you already have workflows exploiting .osm files, the DynaMaps can also help by offering you an in built means of exporting data as a .osm file format. You can than use the excellent Elk package for some more advanced and custom manipulation.

Export to OSM button
Feel free to send your feedback and comments! twitter: @data_shapes , email: mostafa.elayoubi@data-shapes.io
