Hello Dynamo enthusiasts!
We have been brewing some exciting updates for you all—meet the newest member of the Dynamo family, the Curve Mapper node! If you’ve ever found yourself struggling with data transformation to create complex geometry and patterns and wished for a smoother way to handle curves, this node is about to straighten things out and become your new best friend.
For some of you, this new node might look familiar. This is because this node builds upon the great work of Homer Anave and his Graph Map node from the Celery Package. A big shout out to Homer for supporting the Dynamo community!
What is the Curve Mapper node?
 The Curve Mapper node redistributes a series of input values within a defined range and maps them along a specified curve. This means that the values are redistributed in a way that their x-coordinates follow the shape of the curve along the y-axis. In the past, trying to set a sine curve for your geometry involved a lot of trial and error to find the right frequency, angle, and amplitude to get your desired shape. Let’s face it—that was tedious and not so fun! The Curve Mapper node simplifies this process by offering a straightforward way to map points onto a curve, ensuring your curves are as you envisioned.
How to use the Curve Mapper node
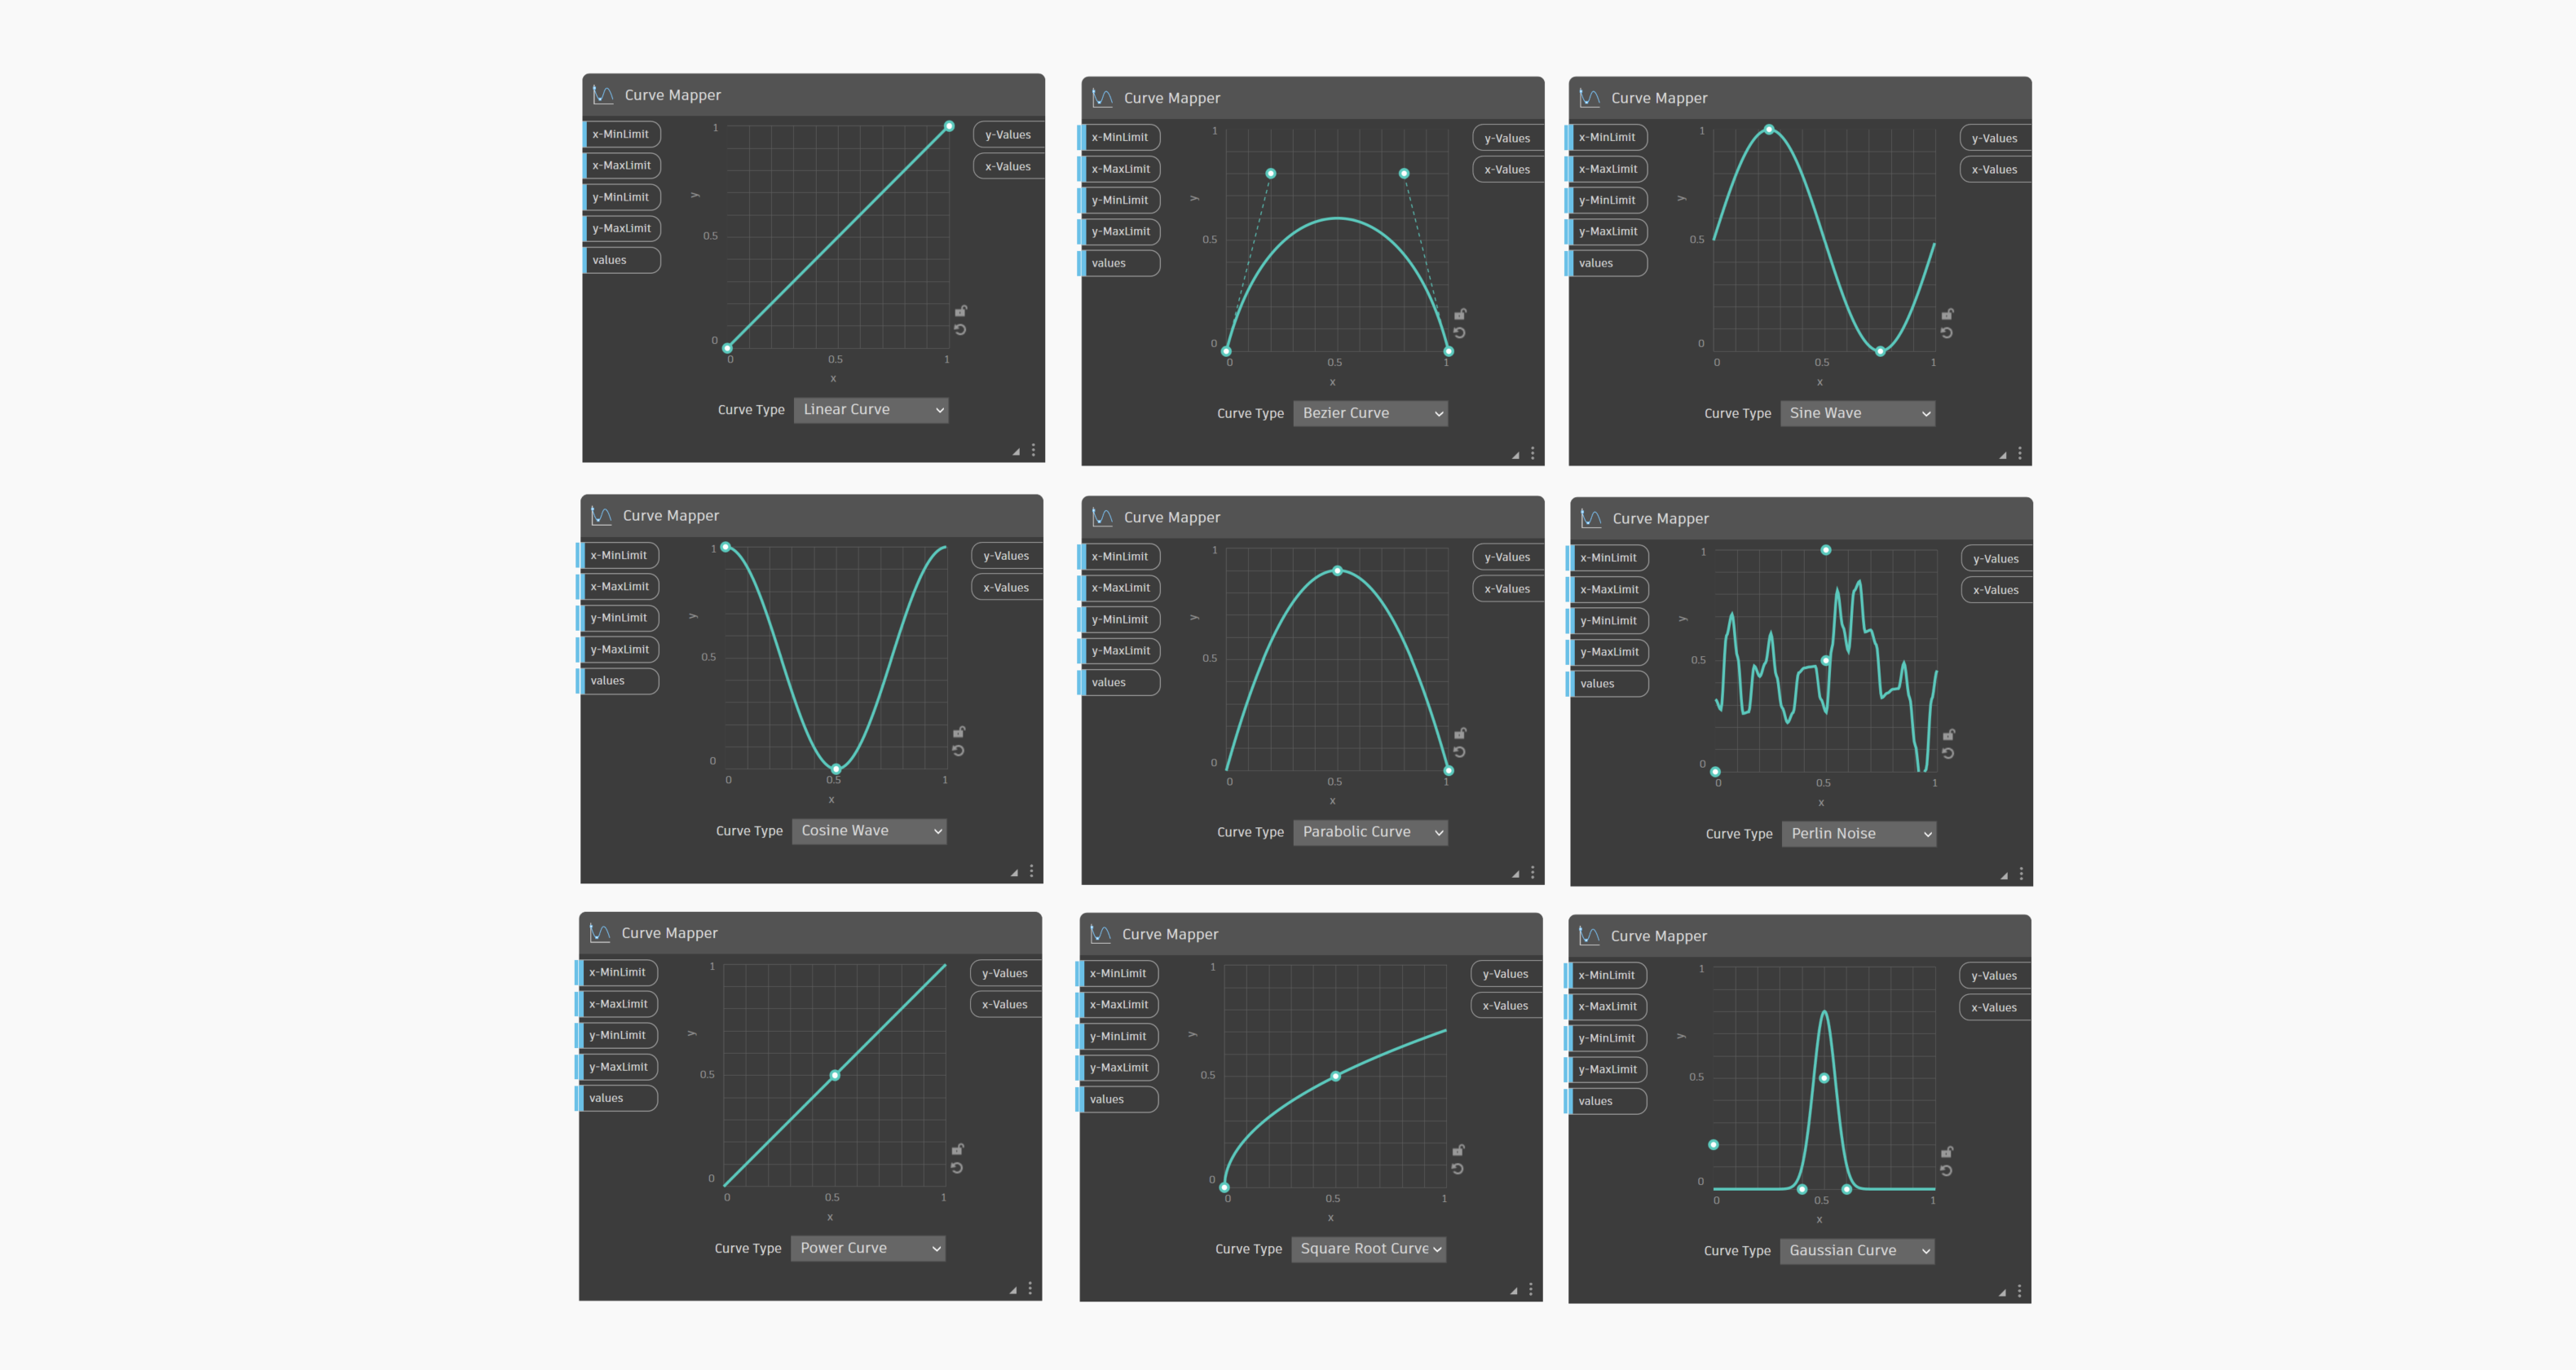
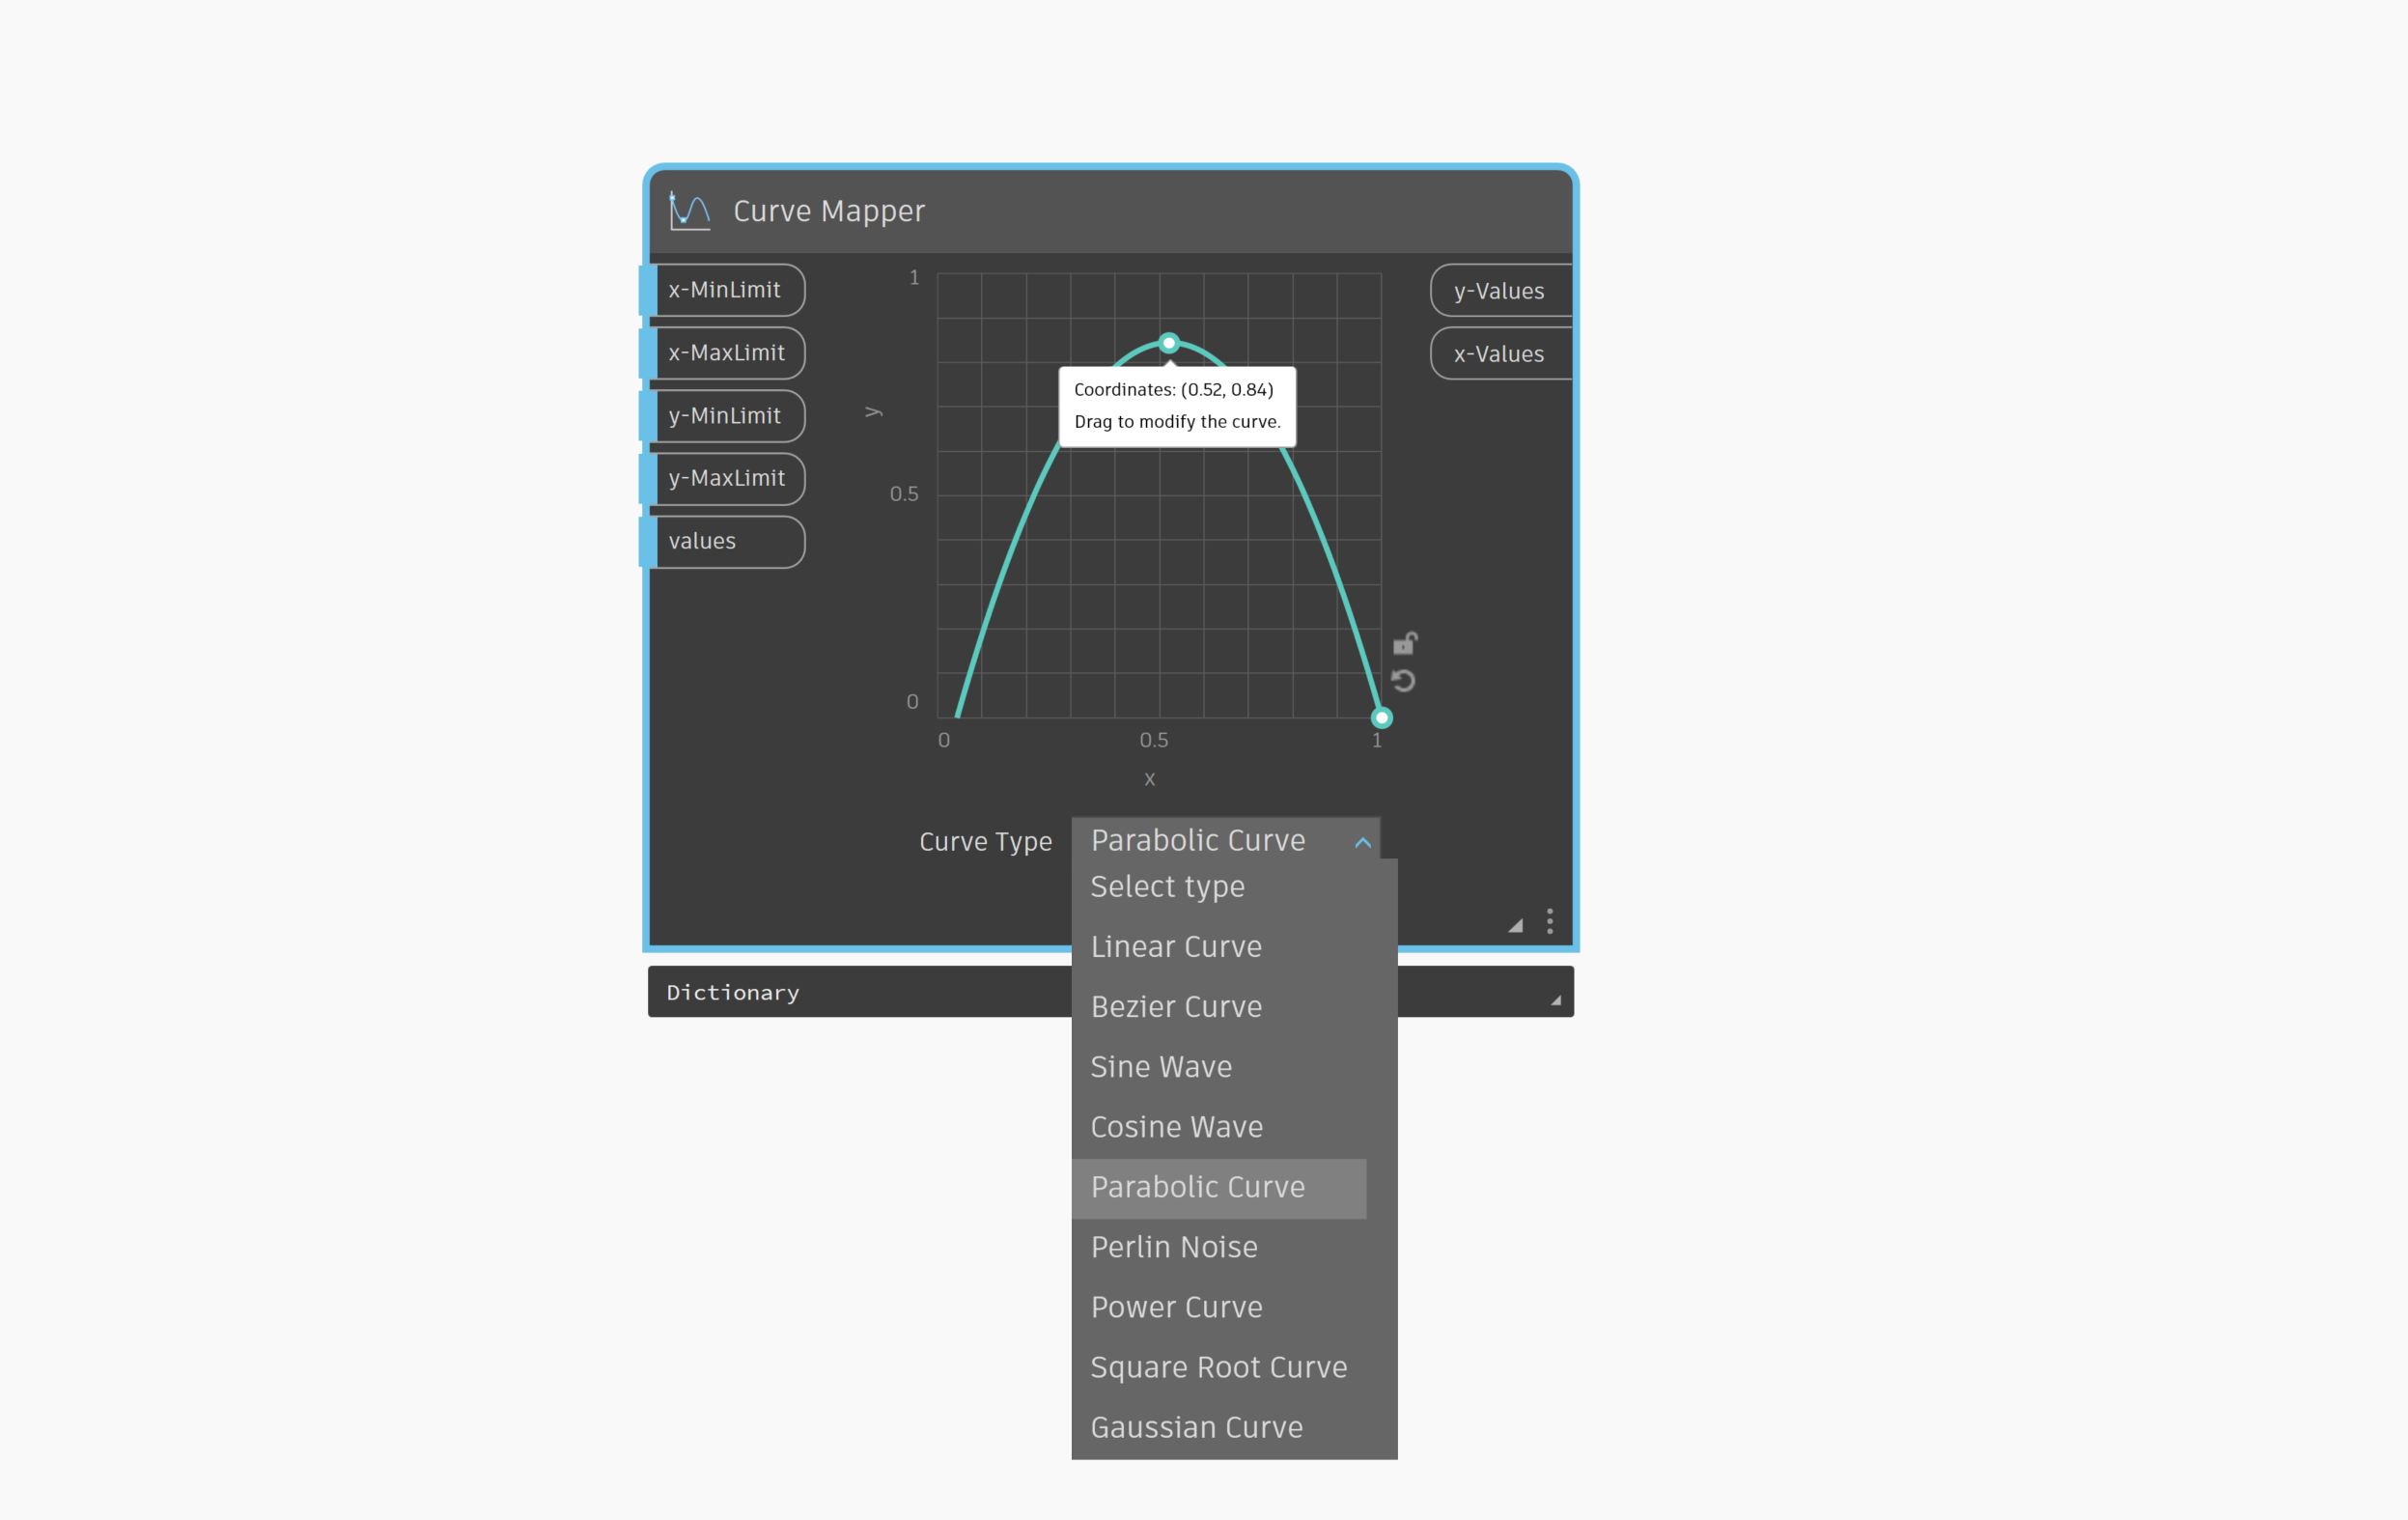
- Select a Curve: Choose a mathematical curve from the provided options, which include Linear, Sine, Cosine, Perlin Noise, Bezier, Gaussian, Parabolic, Square Root, and Power curves.
- Define the Limits: Set the minimum and maximum values for the X and Y domain. These limits set the boundaries within which the points will be redistributed. By default, the minimum is set to 0 and maximum is set to 1. More on how to set the min and max limits in the next section. If Dynamo is in Automatic run mode, the X and Y domains in the node UI will update as per the specified input. If in Manual mode, run the graph to update the min-max in the node UI.
- Define Inputs: You can provide either a single count to generate a series of evenly distributed values or provide an existing series of values. More on when and how to define the series in the next section.
- Set Curve Shape: Use the interactive control points to adjust the shape of the selected curve, tailoring it to your specific needs. You can lock the curve shape using the Lock button, preventing further modifications to the curve. Additionally, you can reset the shape to its default state by using the Reset button inside the node. If needed, you can also resize the node by dragging the triangle icon on the bottom right of the node.
- Generate Outputs: The node redistributes your series of values along the x direction within the specified range (x-Min and x-Max) and then maps these values to the curve to generate the output y-Values. The redistributed series of values along x domain are outputted as x-Values. Note: When mapping numbers along the curve, some Y values fall outside the specified Y-value domain range.
How does Curve Mapper work?
Let’s use some examples to understand in detail how Curve Mapper works and understand when and how to use a count of values versus a series of values as input to “values”.
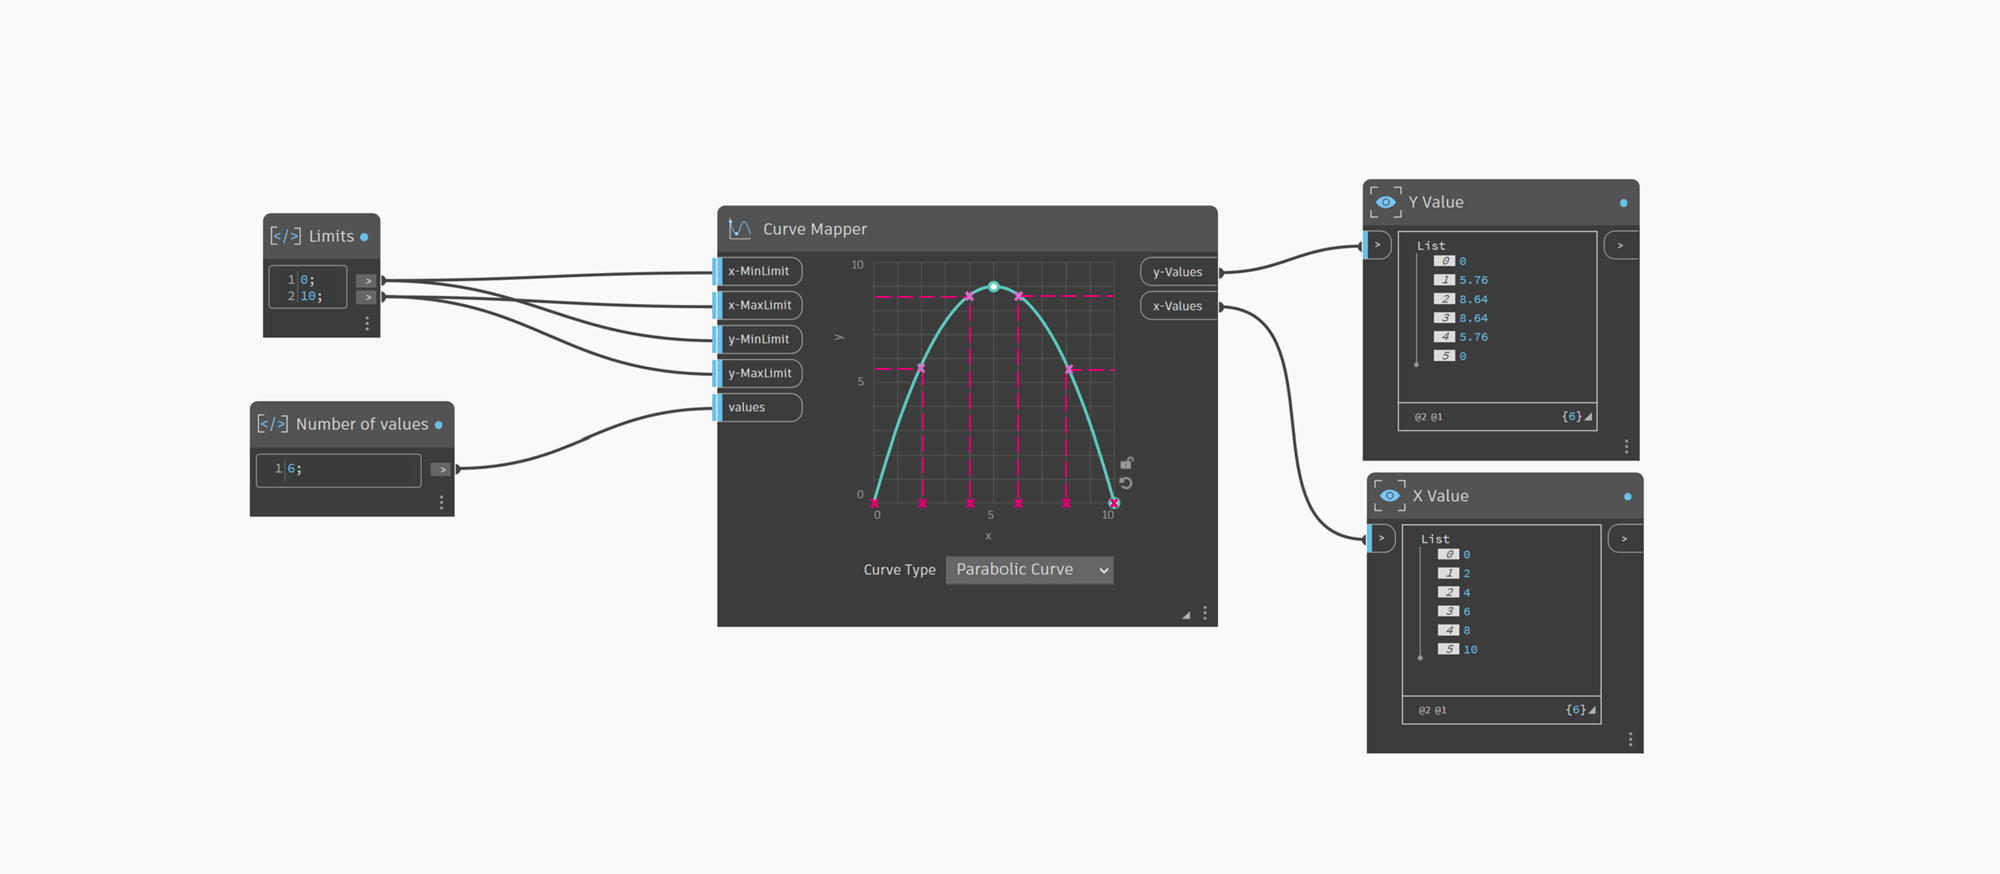
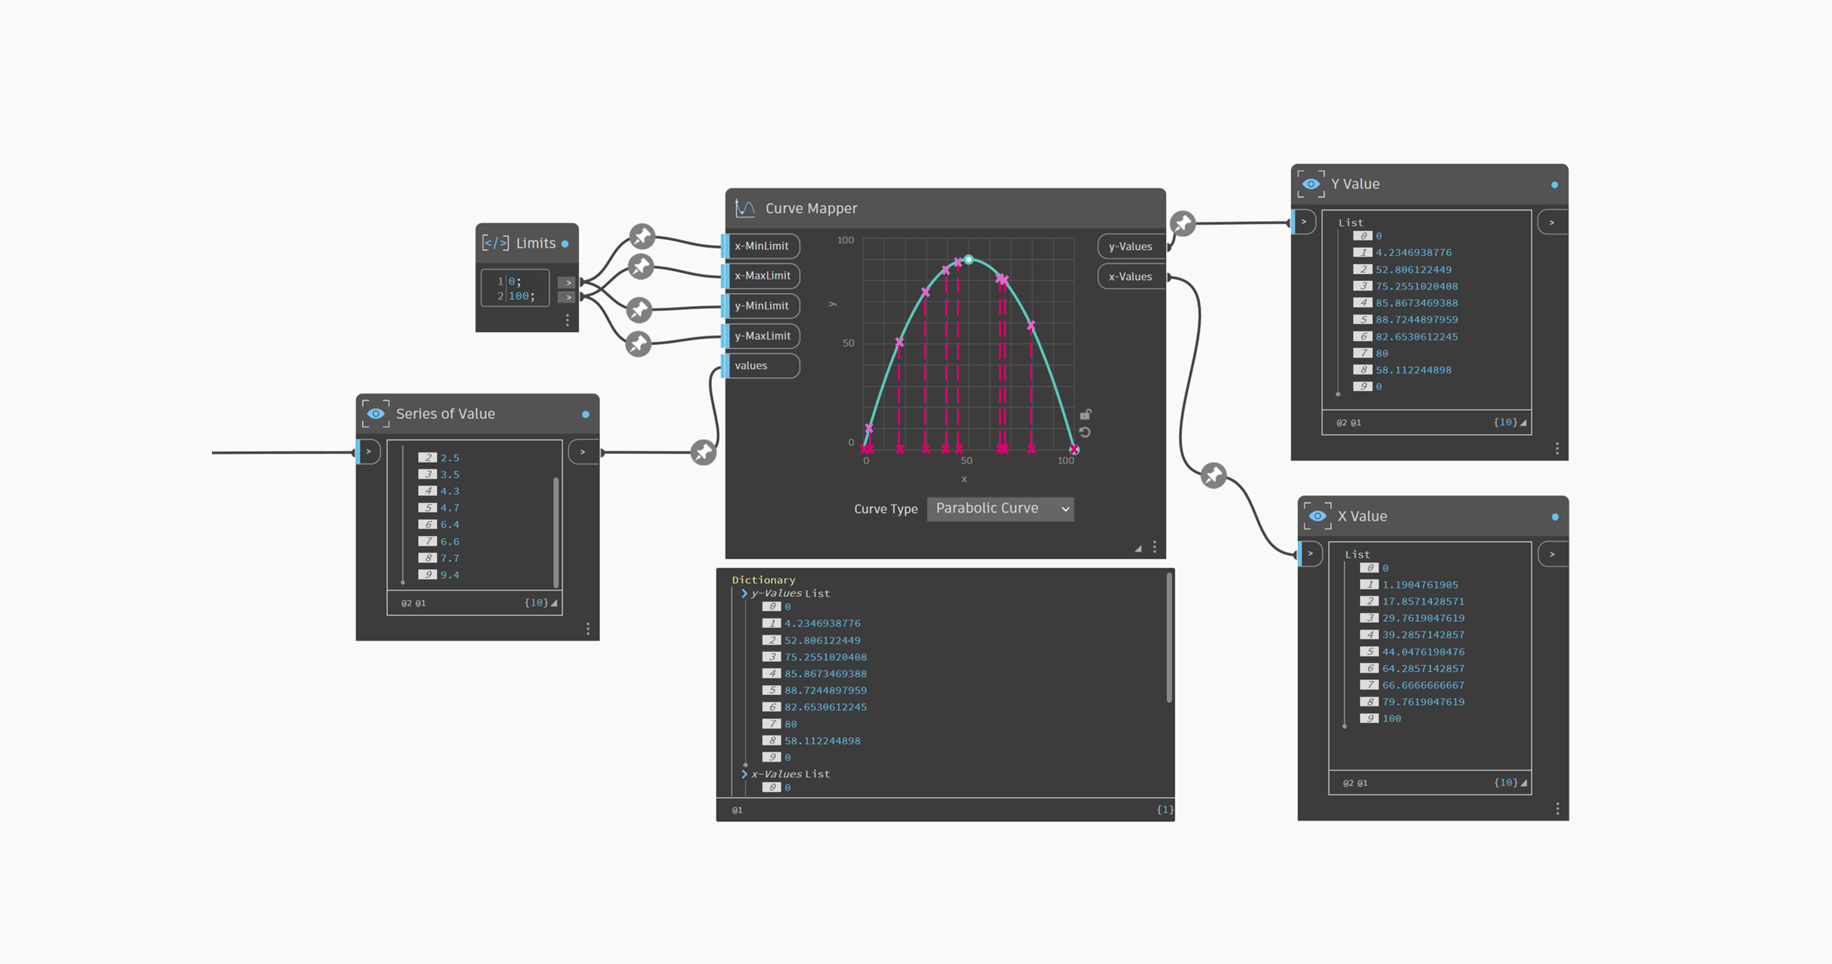
Example 1: You have a min-max range to map
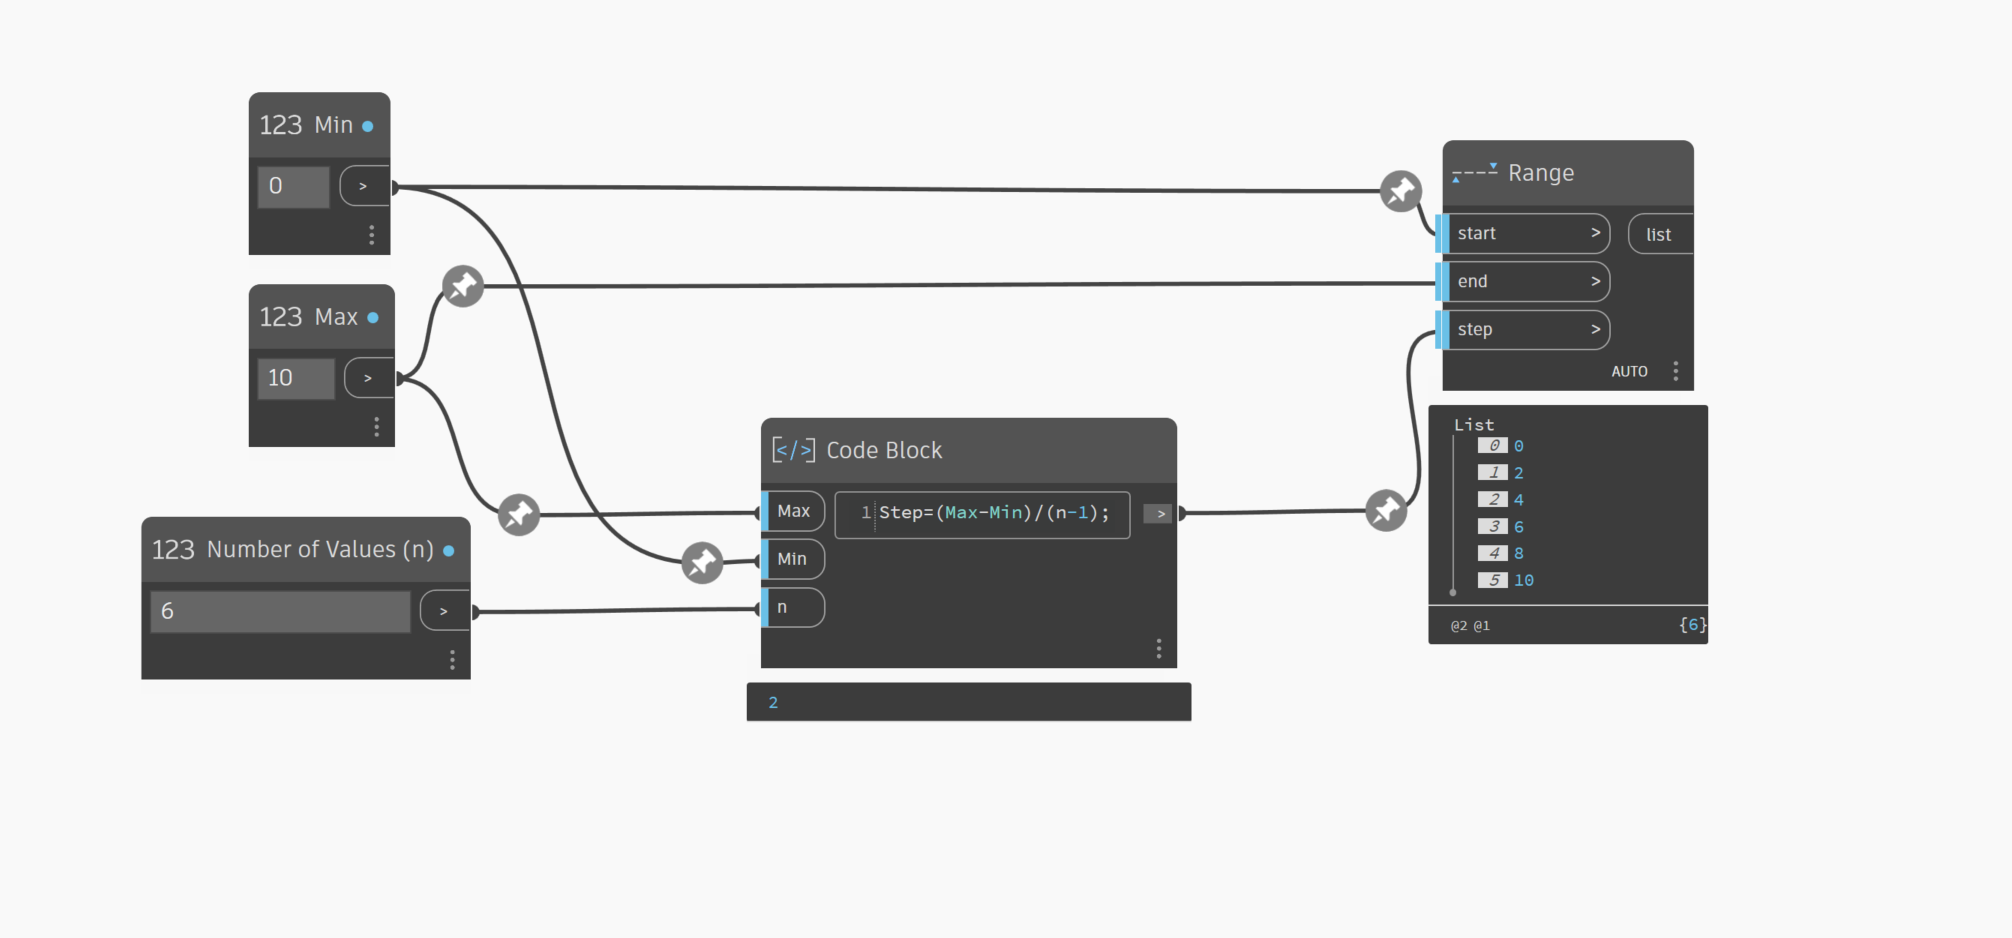
Imagine you have a range of 0 to 10 and want to generate 6 equally spaced values and map them to a parabola curve. The Curve Mapper node generates a series of X-values in the given range distributed equally along the x domain. The node is smart enough that it will generate the series using the range function for you. The snippet below shows how this would look if you used the Range node to generate the series of value.
Curve Mapper then takes these X-values and maps them along the curve using mathematical functions that convert the original values into the redistributed Y-values. This means that the values are redistributed in a way that their x-coordinates follow the shape of the curve along the y-axis.
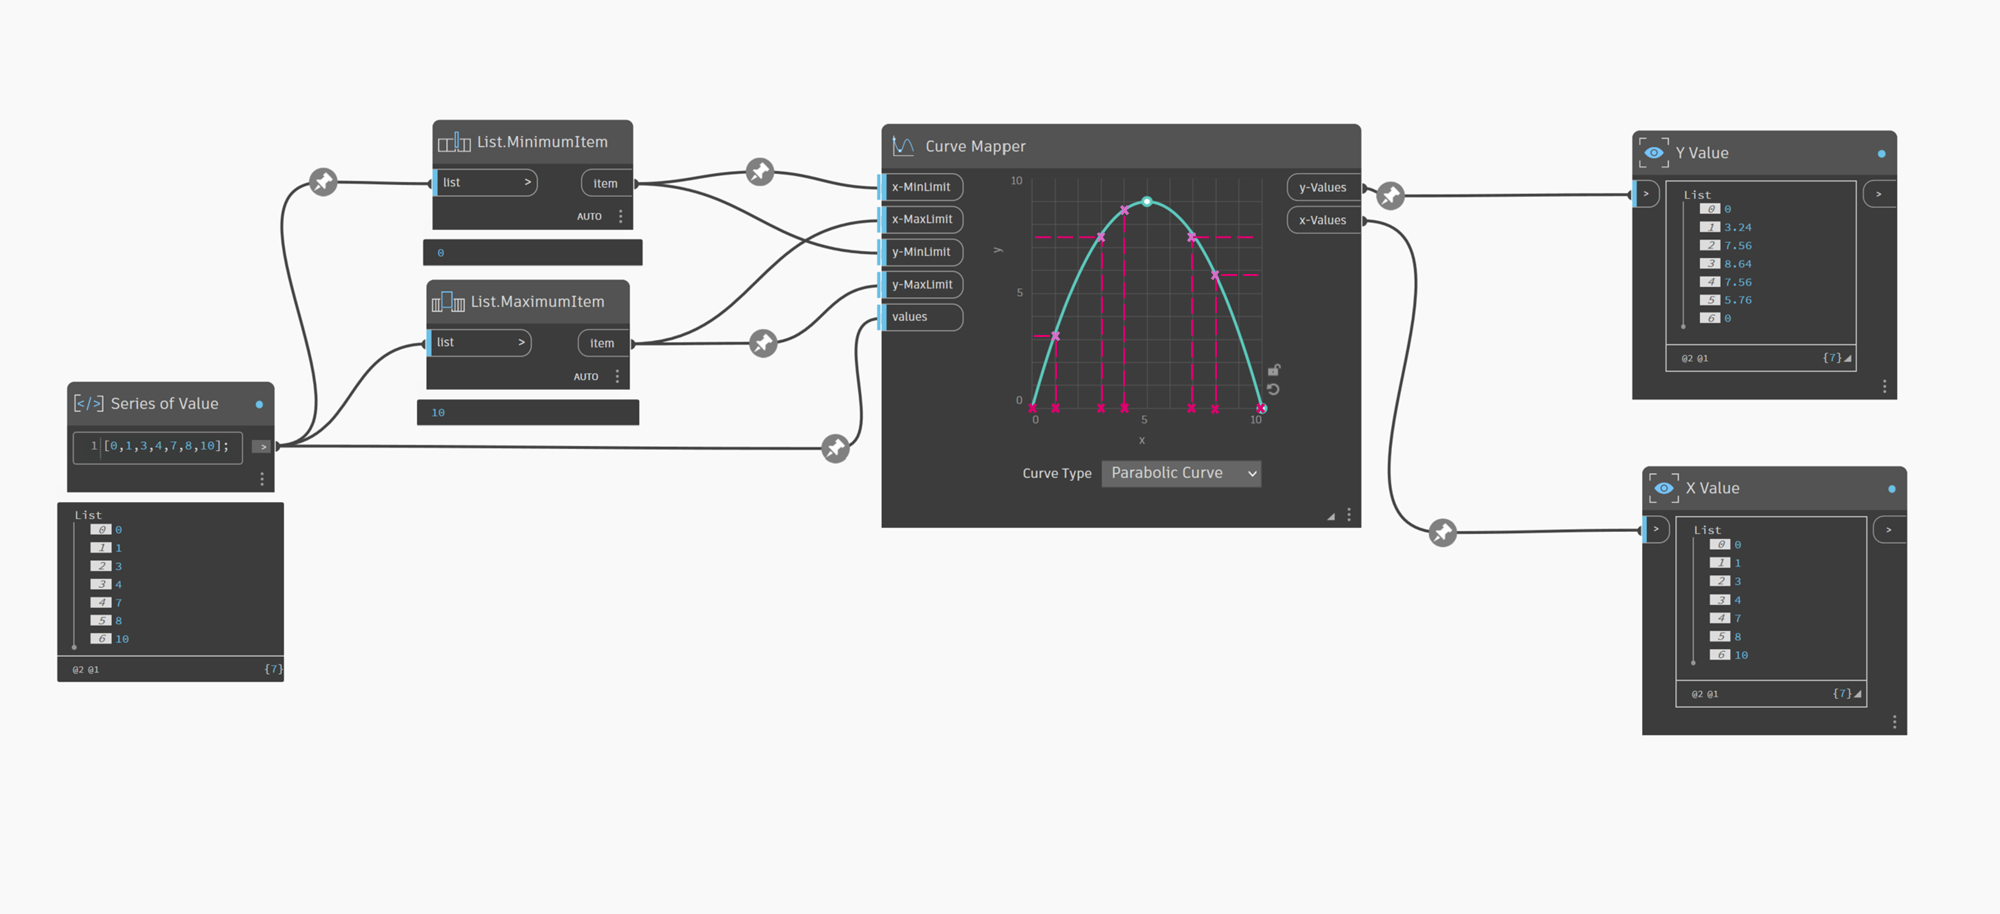
Example 2: You have a series of values from an upstream node that you want to map using same proportions
Imagine you have a series of numbers in the 0 to 10 range, and you want to map these values along a parabolic curve, and you want to redistribute these values while maintaining the same proportions. To properly redistribute all the numbers in this example, you should use the same domain range (i.e., you could set the x-Min to 0 and x-Max to 10). You can also use the List.MinimumItem and List.MaximumItem nodes to determine the min and max range as shown in the image below. Generally, you will use the same range values for the Y domain (y-Min and y-Max), unless you want to use a specific scale factor for mapping the Y-values (more on this below). Note that the series of values need not be equally distributed in the domain.
Curve Mapper then takes these X-values and maps them along the curve using mathematical functions that convert the original values into the redistributed Y-values.
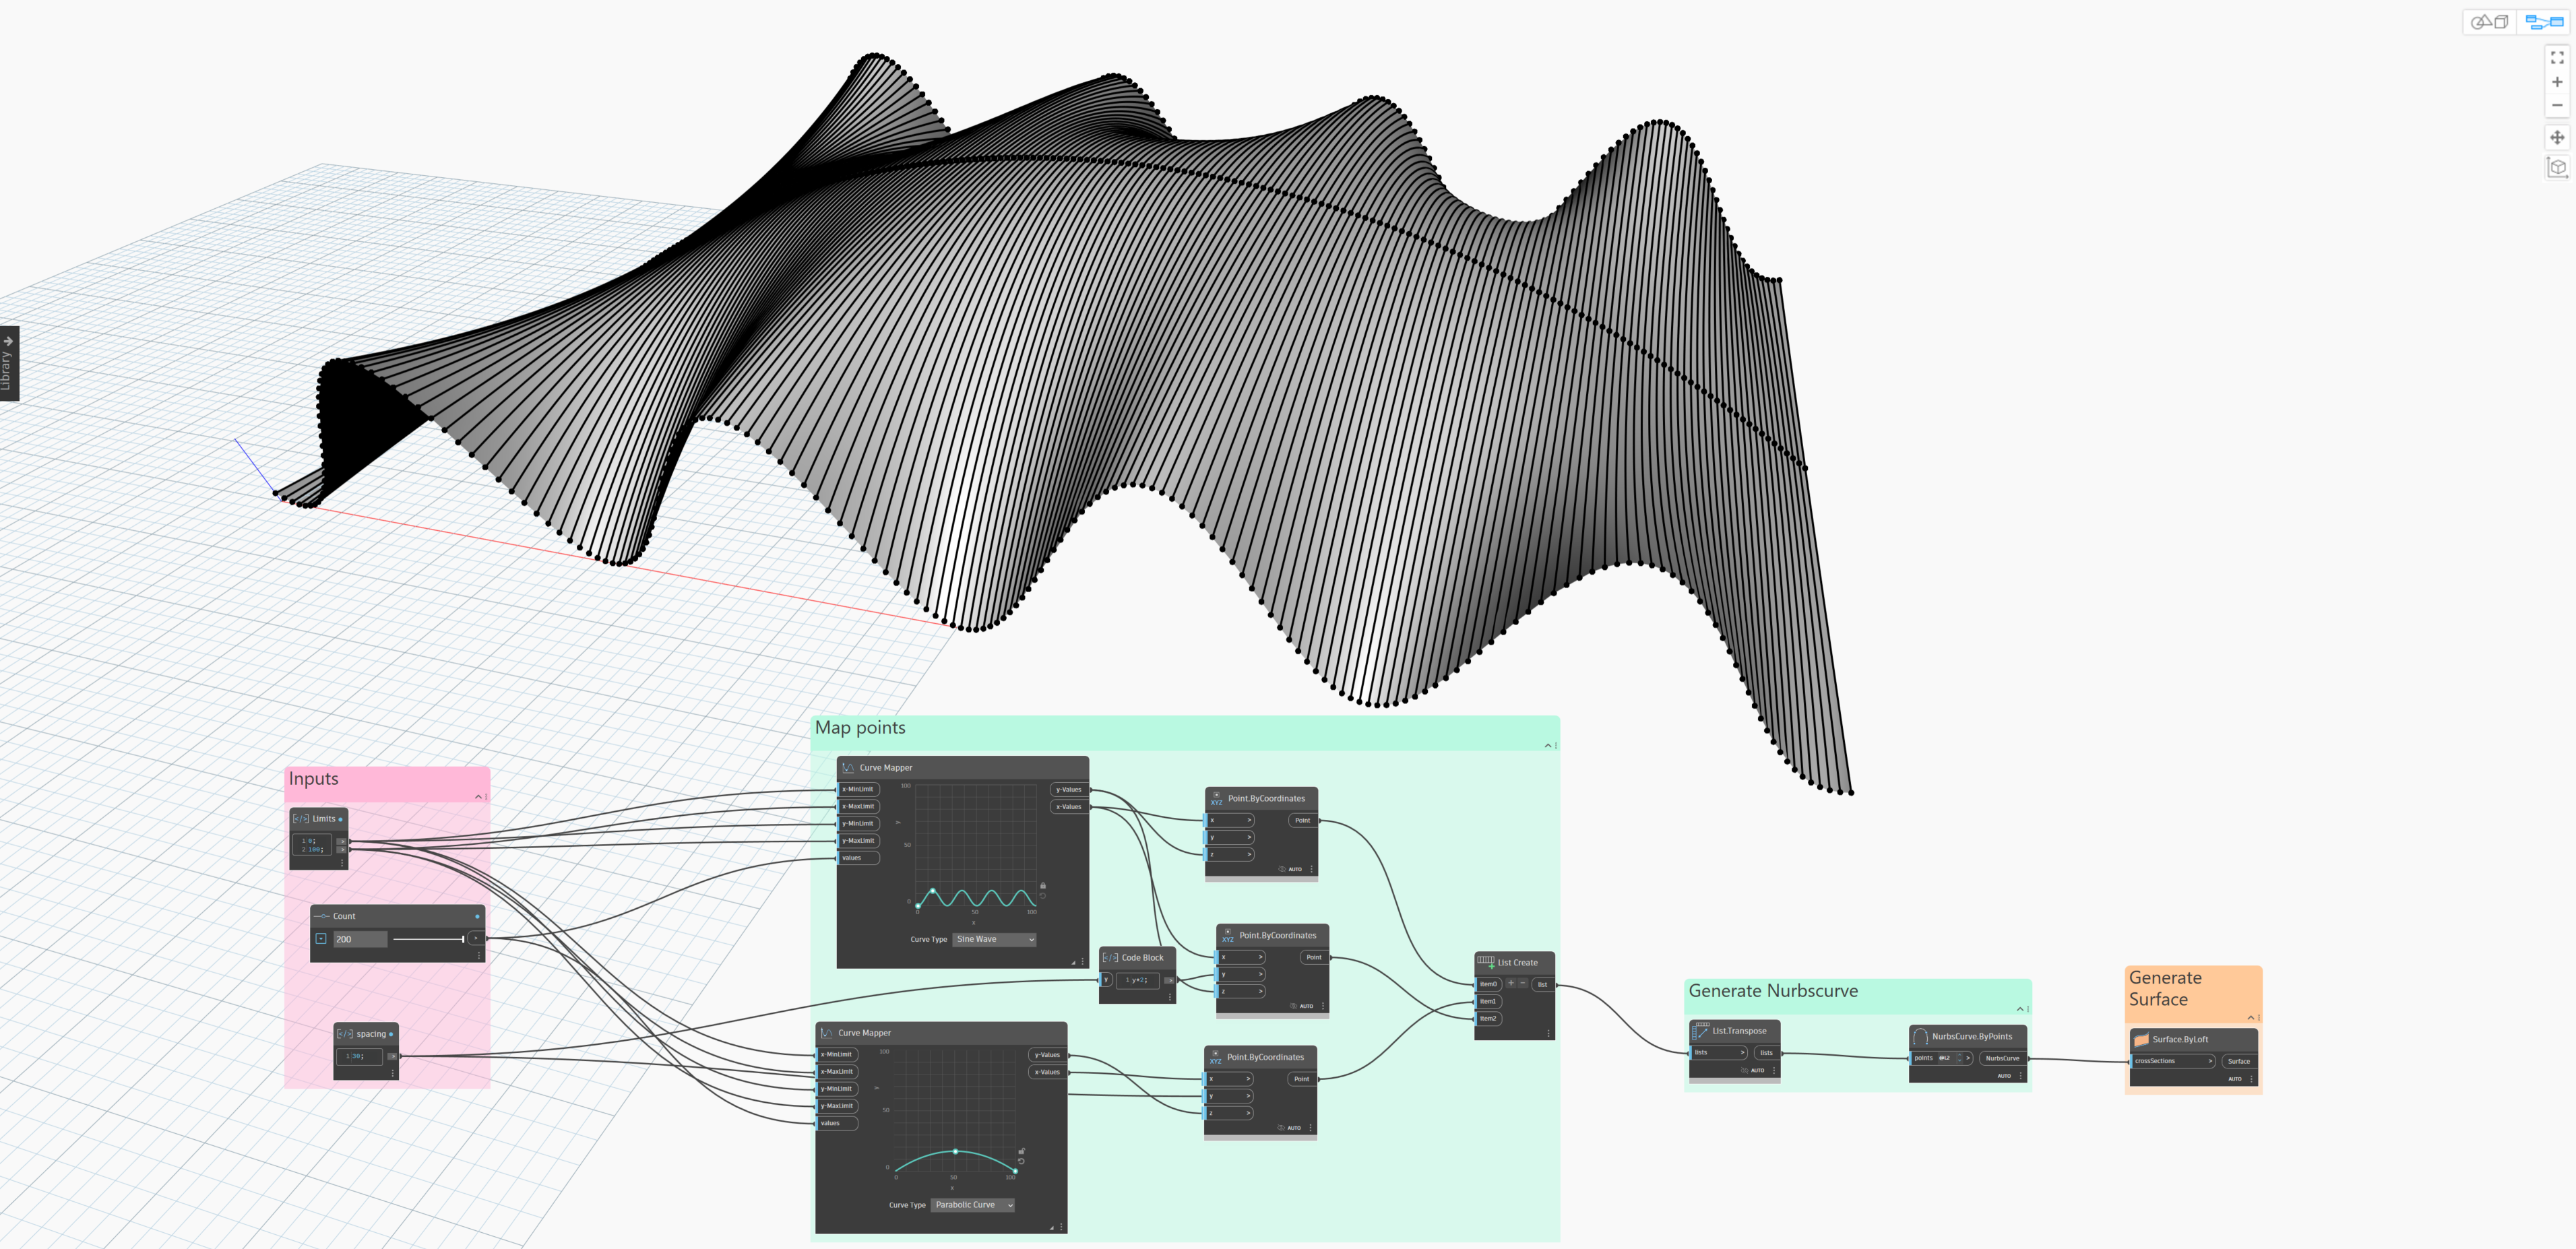
This is useful when you do not have a series of values and want to use the Curve Mapper node to define the shape of your curve or geometry as shown in the image below:
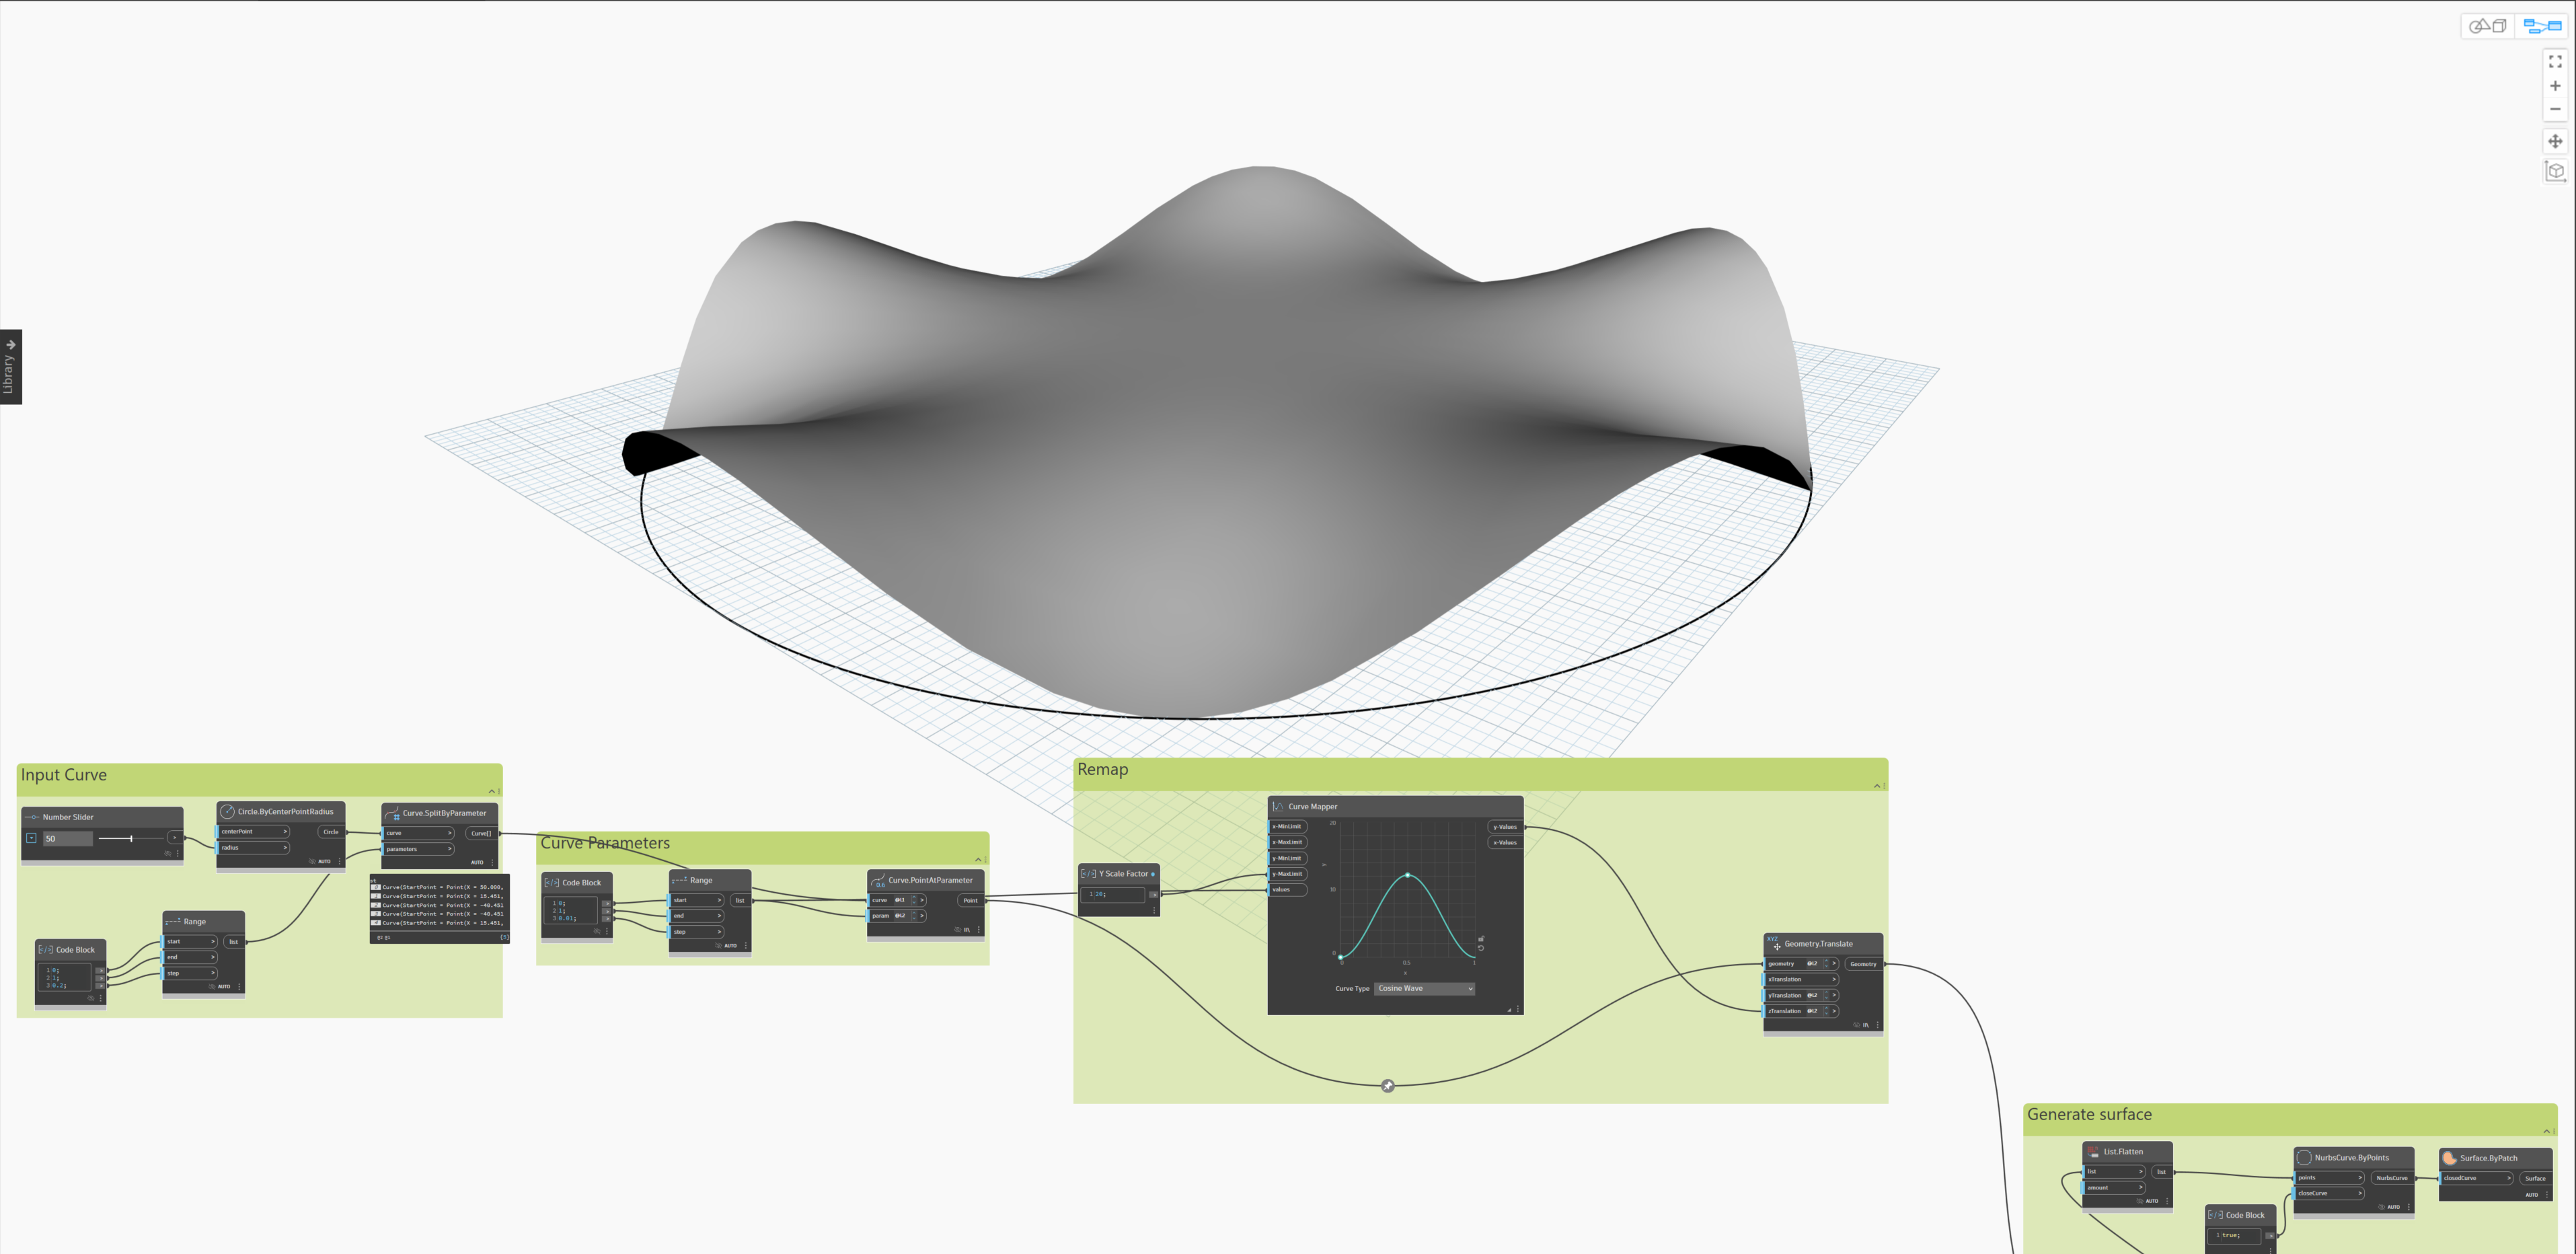
Example 3: You have a series of values from an upstream node that you want to map using a new domain range
Imagine you have a series of values from an upstream function that you want to remap to a new range and map along a curve to generate your geometry. Provide the series of values as input “values” and define the x-Min and x-Max of the new domain you want to remap the values to. Generally, you will use the same range values for the Y domain (y-Min and y-Max), unless you want to use a specific scale factor for mapping the Y-values (more on this below).
The Curve Mapper node will first redistribute the series of those numbers into a new specified range shown as x-Values in the Outputs. It adjusts the range of a list of numbers while preserving the distribution ratio, as it uses a linear scaling of those numbers into a new specified X domain range. Note here that the series of values need not be equally distributed in the domain.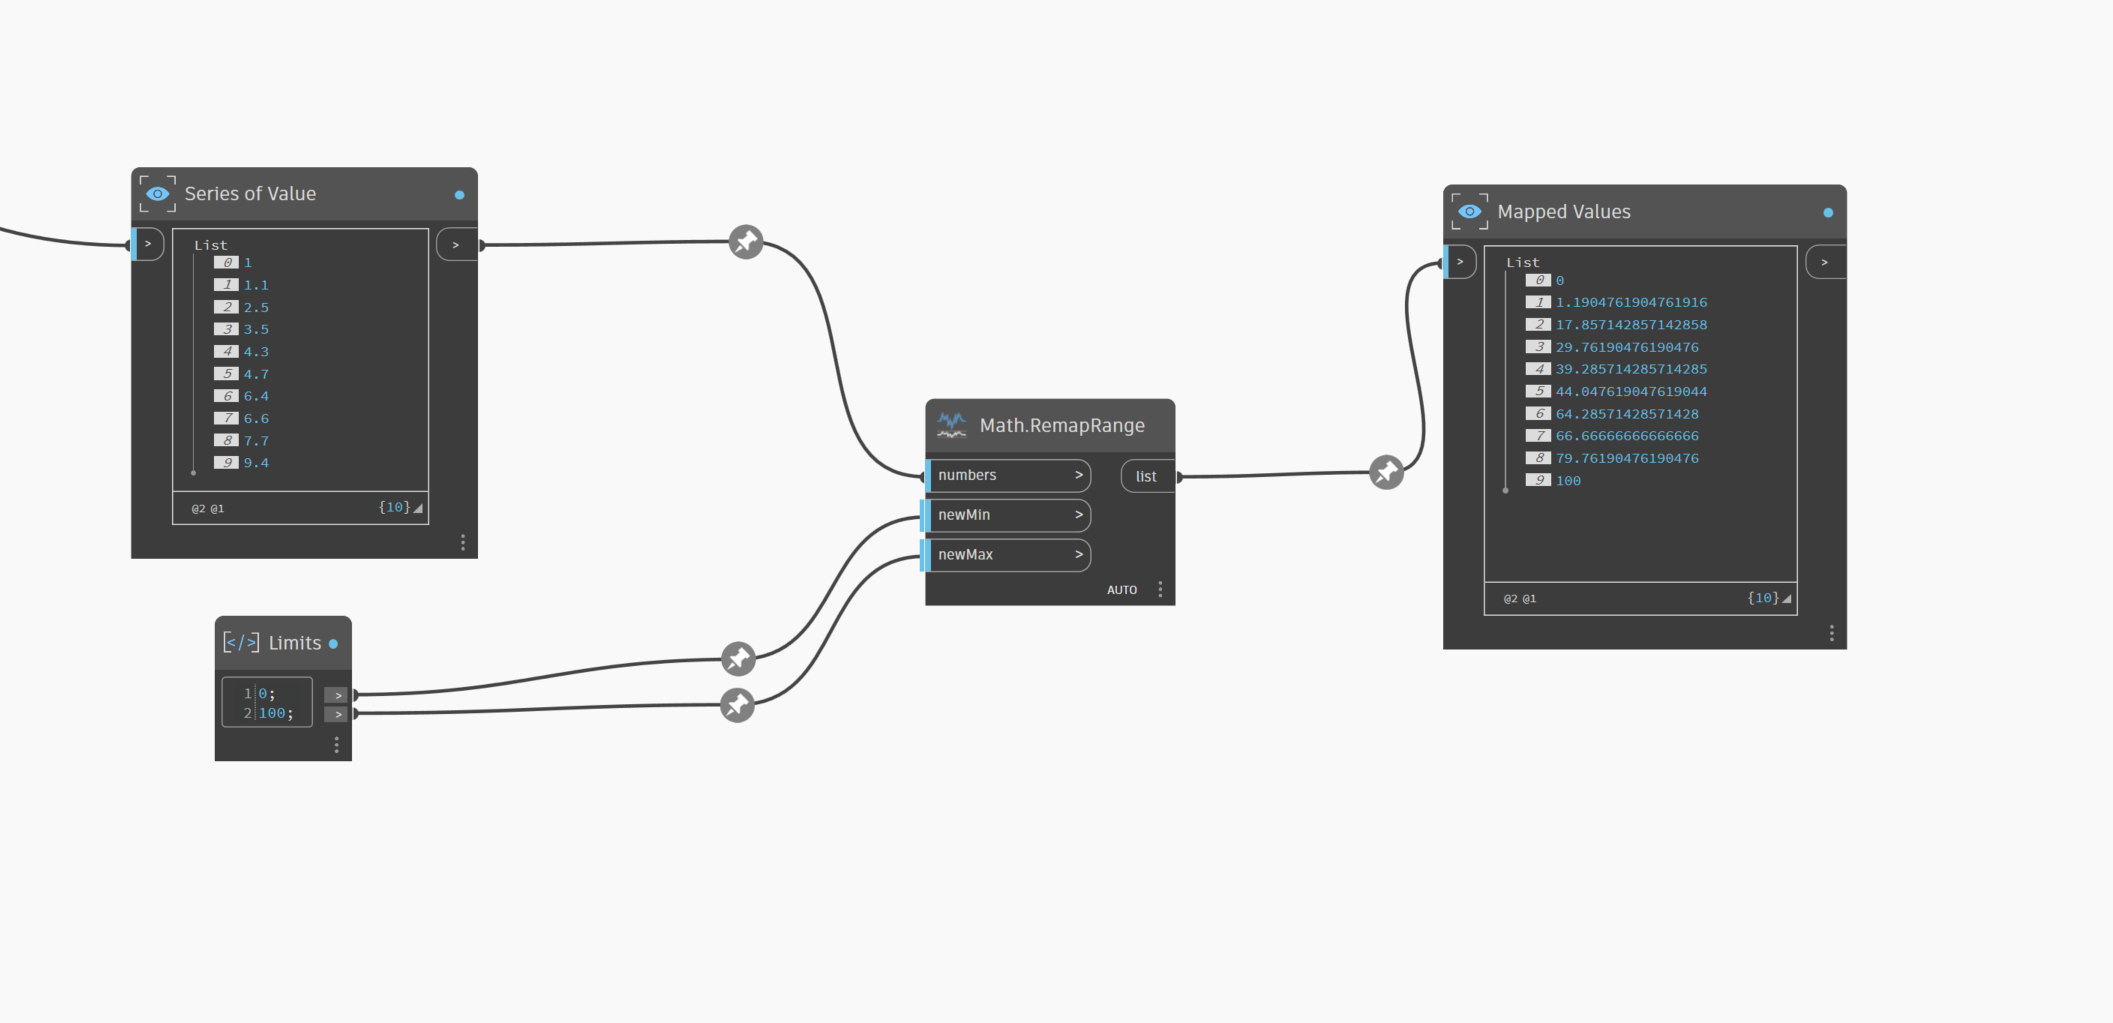
Curve Mapper then takes these redistributed X-values and maps them along the defined curve using mathematical functions that convert these values to generate the output y-Values. The redistributed series of values along the x domain are outputted as X-values.
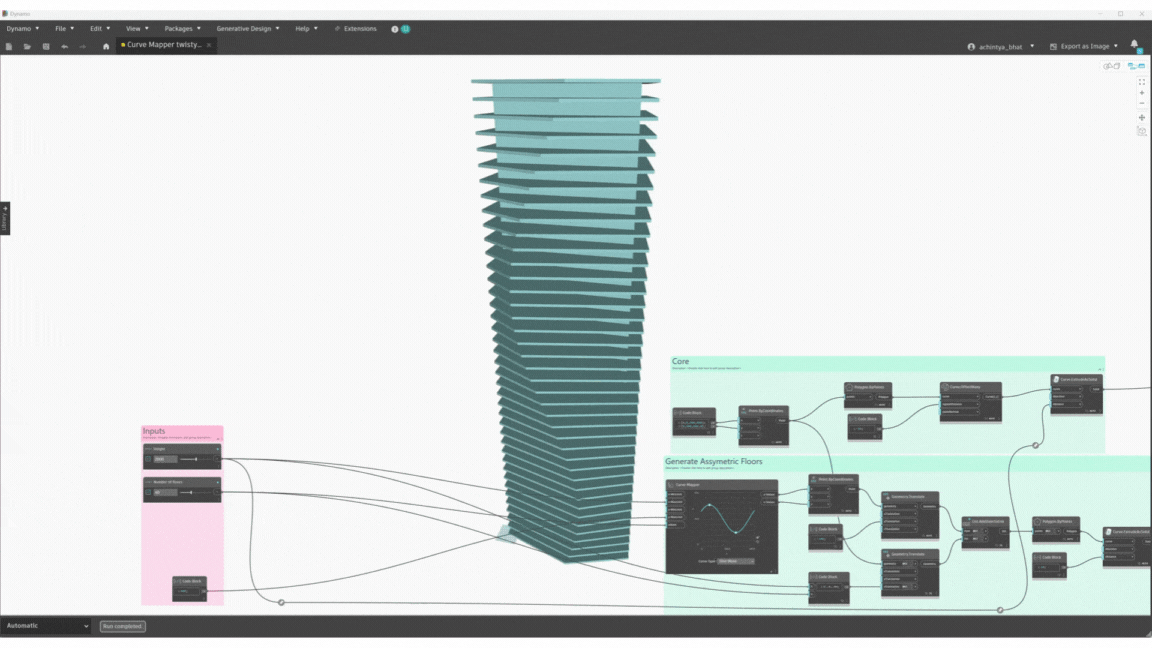
For example, you have an input curve from an upstream node, and you want to map the parameters along a parabolic curve shape to get the z translation value for the points at these parameters to generate a parametric surface. You can use the series of initial curve parameter values as input values for the Curve Mapper node as described in this use case.
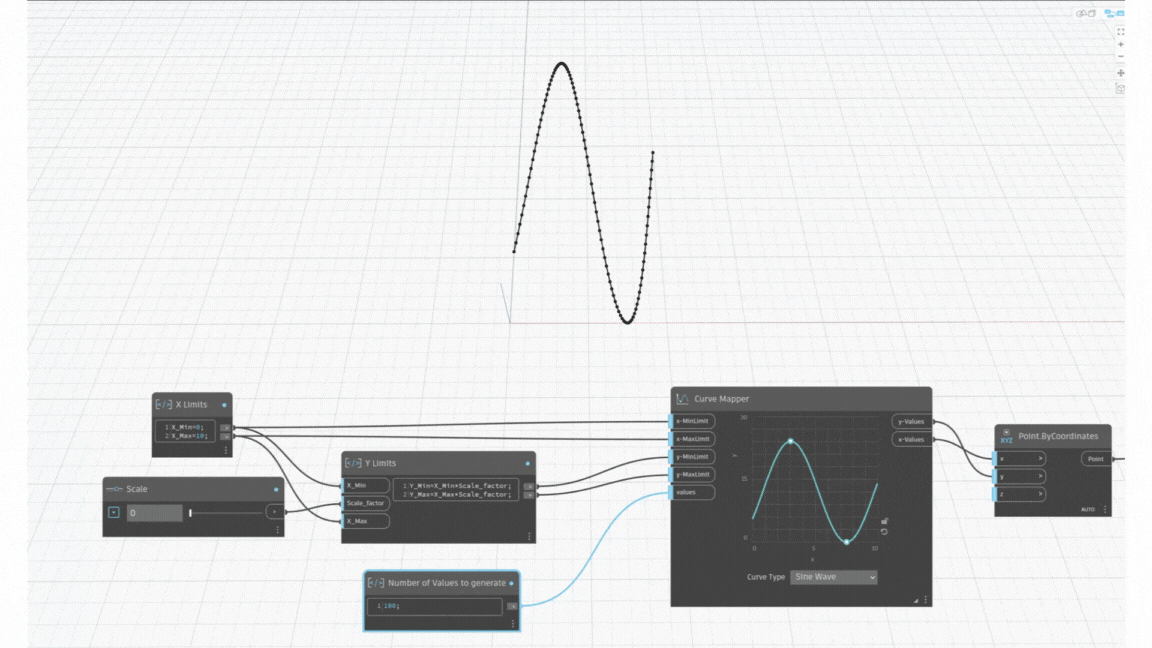
Example 4: You want to use a scale factor for Y domain
Using consistent range for X and Y axis ensures that the transformation maintains the original proportions of the input data. However, if you need to scale the Y-values for a particular design requirement, adjusting these Y-Min and Y-Max limits allows you to control the vertical distribution of points along the curve.
For example, suppose you are designing a façade that requires a wave-like pattern with varying heights. By adjusting the y-Min and y-Max values, you can scale the amplitude of the wave, creating a more dynamic and visually appealing design.
Why use the Curve Mapper node?
The flexibility of the Curve Mapper node makes it an invaluable tool for a wide range of design applications. Here are some key reasons why we think you should consider using the Curve Mapper node in your projects:
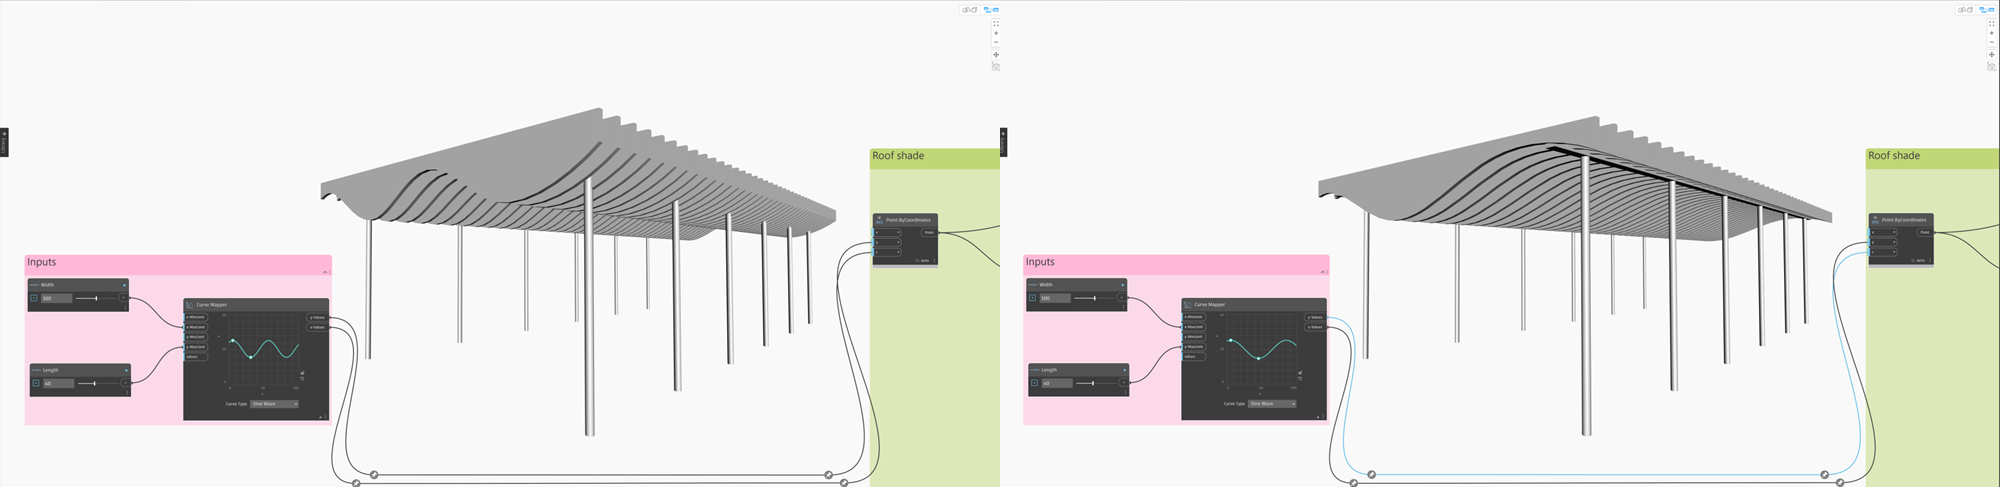
- Architectural & Structural Design: Easily create complex and visually stunning façade, canopies, structural glulam beams, and parametric roof designs with evenly spaced elements. Whether you’re designing a modern building or a unique structure, the Curve Mapper node ensures precise alignment and distribution of elements along curves.
- Civil Engineering & Urban Design: Align components and elements along curved paths with exact control over their distribution. This is particularly useful for designing light poles, piping systems, and other utilities that require precise placement and orientation.
- Landscape & Interior Design: Design flowing pathways and organic shapes that follow the natural terrain or proposed layouts, and orient trees/plants and water features precisely along curves. The Curve Mapper node helps you tailor your designs to fit specific project requirements, whether you’re creating a garden, park, or other outdoor space.
Known issues
We are aware of some issues with the Curve Mapper node that we are actively addressing and will improve in the next release. We could have kept you waiting until everything was perfect, but we saw your excitement and couldn’t wait to share this gem with you. So, if you run into these little quirks, rest assured that the Dynamo team is on the case:
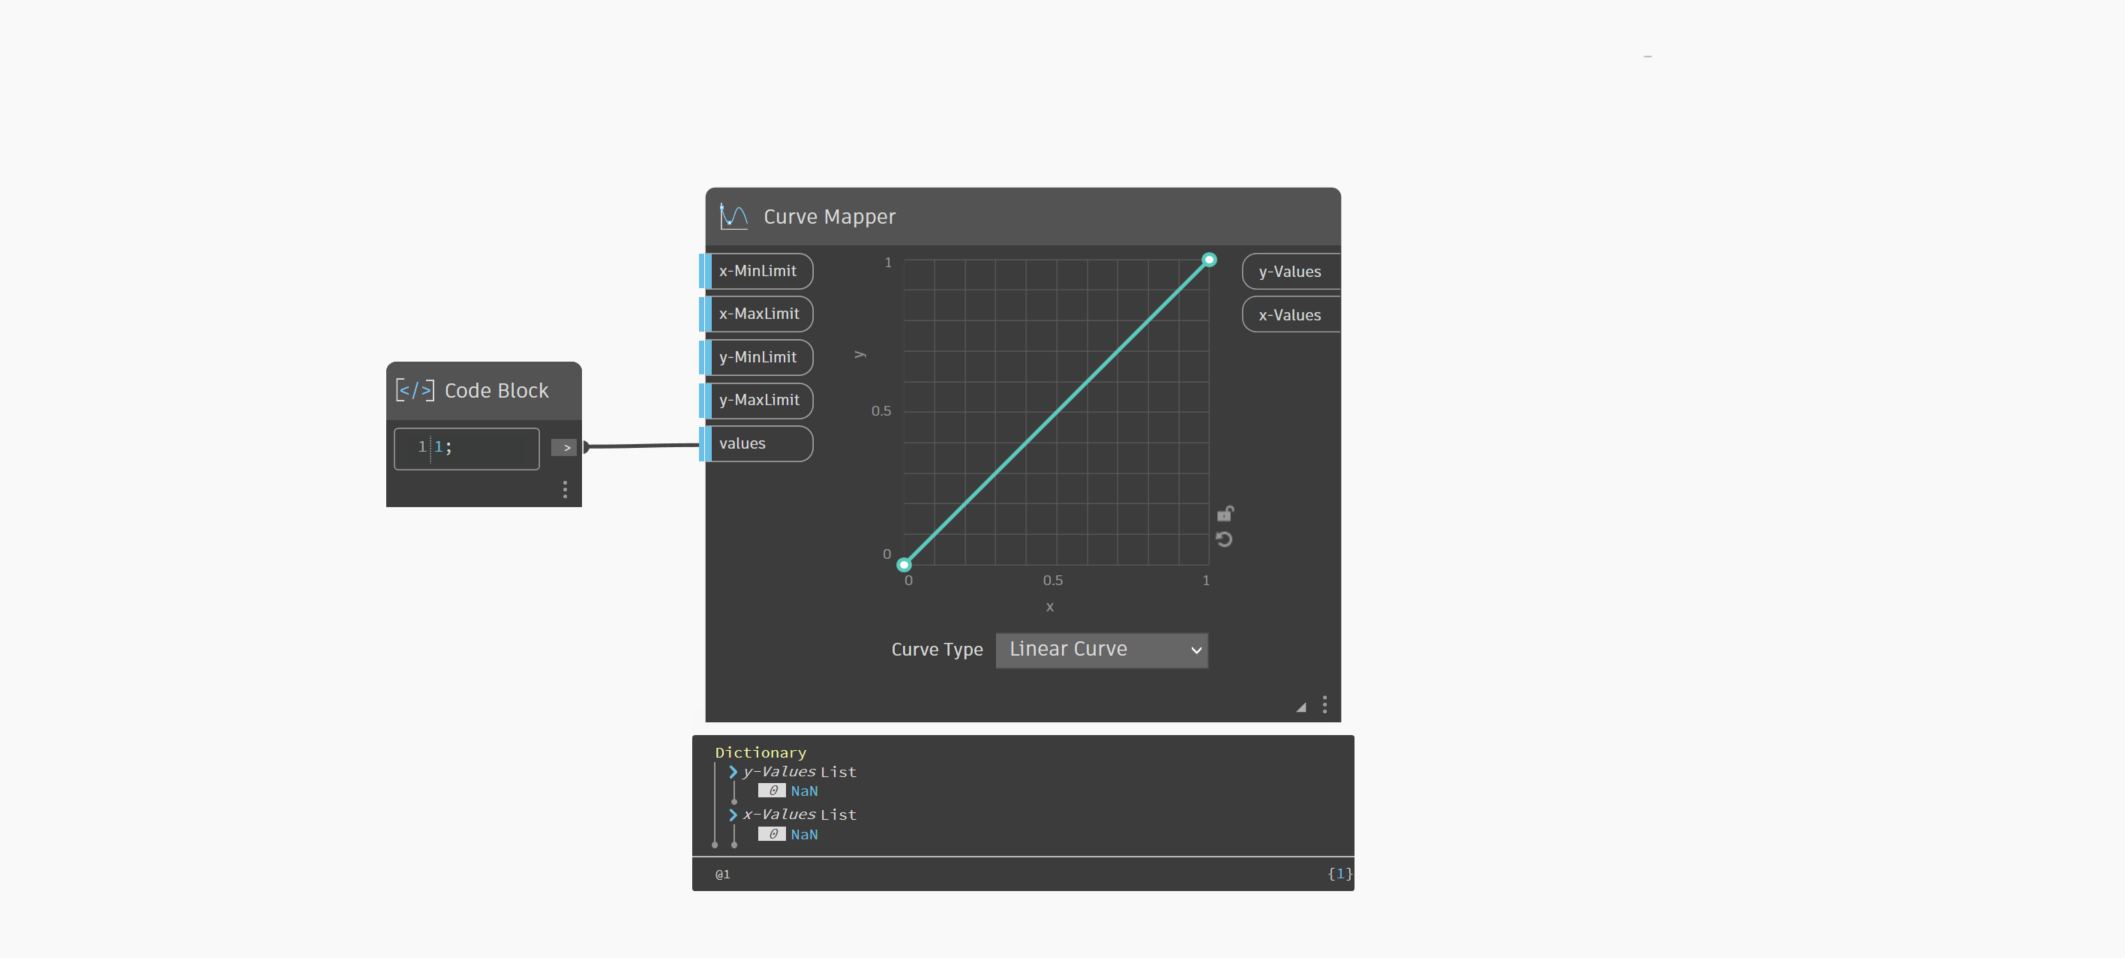
- Missing Warning States: (a) When the input to the “values” port is set to 1, you will see the output as NaN (as shown in the figure below) as the node at least needs a minimum of two values to map. (b) If the output is null, check to ensure that the shape of the curve supports the mapping of the values.
- Undo Functionality: Currently, hitting undo doesn’t straighten out the curve shape. Since this node juggles two sets of inputs (input ports and UI), undoing actions is a bit of a curveball. But don’t worry, we’re working on it!
- Copy-Pasting: Copying and pasting the Curve Mapper node doesn’t give you a carbon copy of the curve shape; instead, it resets to a fresh state. We’ve got our heads down fixing this ASAP.
We appreciate your patience and understanding as we work to enhance the Curve Mapper node.
Conclusion
The Curve Mapper node is a versatile and powerful tool that opens up a world of possibilities for your designs. Its ability to redistribute values along curves, combined with interactive control and customization, makes it an essential component for achieving precise and dynamic design outcomes.
We’d love to hear from you! Tell us what we’re missing and share how you’re using the Curve Mapper node in your projects. Your feedback and creations help us improve and inspire others in the Dynamo community. Send us your thoughts, questions, and masterpieces—we’re excited to see the incredible designs you’ll craft with this new node!
The Dynamo Team