Summary
Dynamo has been around for a little while now. I think we can all agree that it has reached a level of maturity/sophistication that has far surpassed its humble beginnings in Autodesk Vasari.
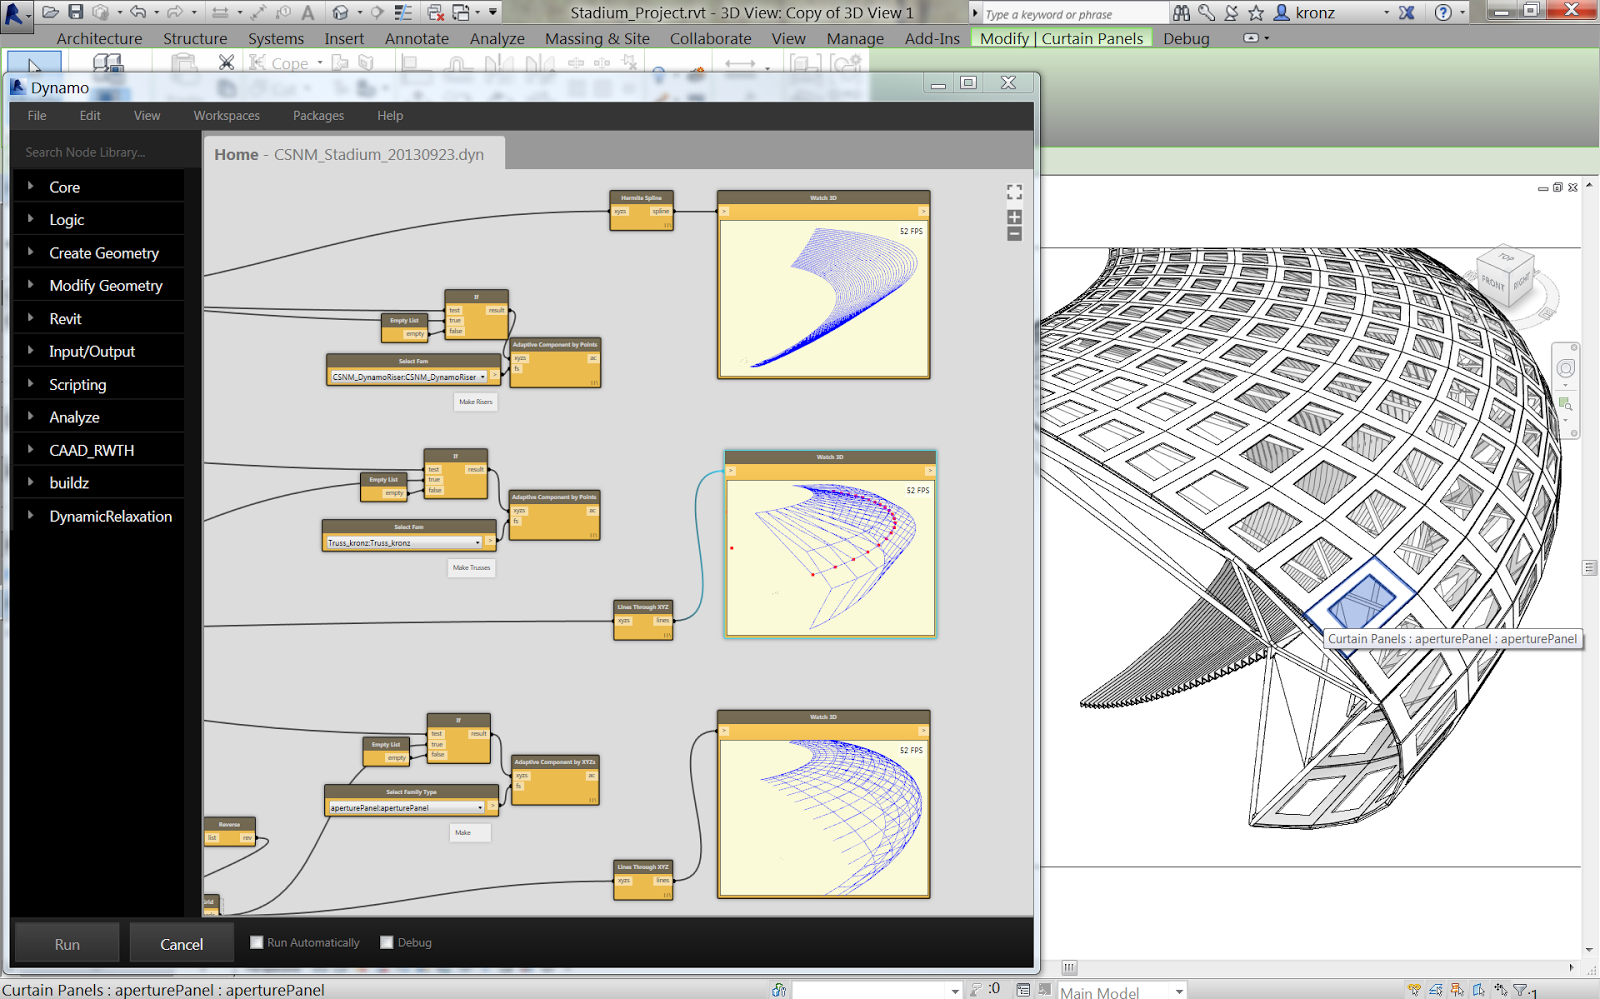
Dynamo UI from way back when (image courtesy of https://buildz.blogspot.com/2014/01/dynamo-stadium.html)
At the time of this writing, Dynamo is integrated into several Autodesk products. These include (but are not limited to), Revit, Civil3d, Alias, FormIt, Advance Steel, and Robot Structural Analysis.
In addition to all of these integrations, there are version differences at play. For this post, we are going to focus on the Revit integration. For Revit specifically, we are able to maintain Dynamo graphs from Revit 2023, all the way back to Revit 2020; as long as you keep a few things in mind.
In this post, we will break down a few of the key considerations when maintaining a library of Dynamo graphs for several Revit versions.
- Dynamo Versioning
- Dropdown Considerations
- Custom Package Usage and Best Practices
Which version should I build my graph in?
With Revit 2023, the Dynamo team introduced a new look and feel of Dynamo. Personally, I think it looks really nice.
 Dynamo 2.12 and Older Look |
 Dynamo 2.13 and Beyond Look |
The downside of this change is that the nodes are significantly bigger, resulting in graphs that look like this when upgraded.
 Thankfully this is fixable after the fact with workflows to rescale the graph. Shoutout to Jacob Small from Autodesk for sharing a workflow for this here: https://forum.dynamobim.com/t/graph-resizer-for-dynamo-2-13/75612
Another method is available in the Monocle view extension that does this scaling dynamically: Monocle Graph Resizer Video.
However, planning for these size changes is far more important than fixing them after the fact. With this in mind, the current suggestion is to build the graphs in the highest version you plan on supporting (For this post, we will say that is Revit 2023/Dynamo 2.13).
In addition to sizing changes, we can also utilize new features available to us, like Graph Properties. While this feature will not work in older versions of Dynamo (because it did not exist), you can have that feature in place for Dynamo 2.12+ while maintaining compatibility with every version back to Dynamo 2.0.4.
Take this graph that calculates window-to-wall ratio, for example. This graph was built in Revit 2023 with Dynamo 2.13.1.
 Window-Wall-Ratio Graph in Dynamo 2.13.1 |
Building this graph in Dynamo 2.13 allows us to account for the node size changes and have the graph properties filled out for Dynamo player.
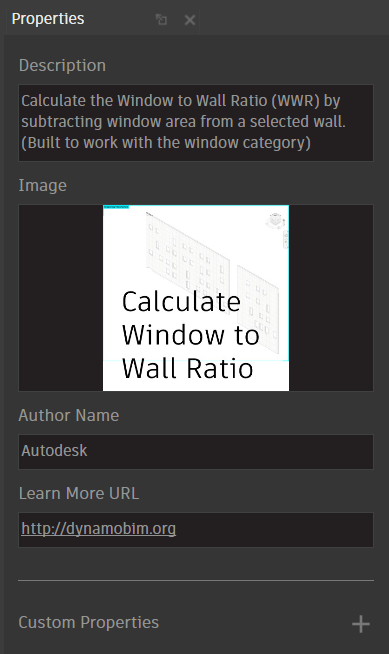 Graph Properties View Extension |
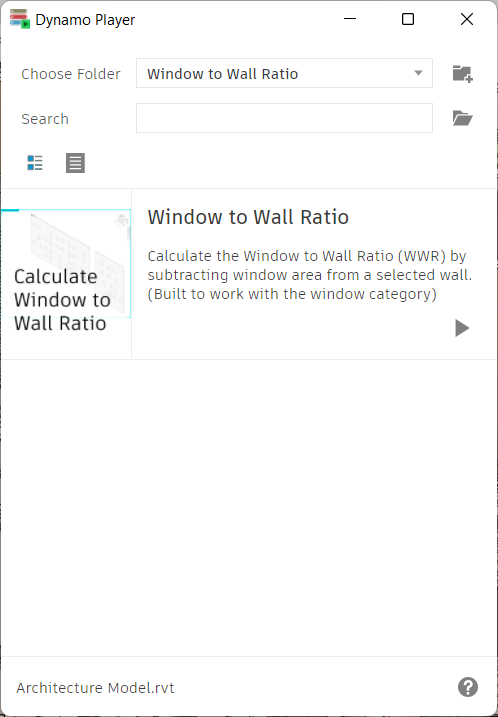 Graph Properties Revealed in Dynamo Player |
This is great because we are taking advantage of all of the new great features available in Dynamo 2.13.
Now, let’s look at this same graph in the lowest currently supported version of Revit*, Revit 2021.
(*this is typically the current version and two previous).
First, we try to open the graph in Dynamo 2.6.1 in Revit 2021.
 Attempting to open the graph in Dynamo 2.6.1 |
As you can see, this graph does not open, and the log does not report why.
The cause for this is dropdowns (more on that later). But the summary is; dropdowns were fixed in Dynamo 2.12.x to remember selections, which caused a regression in previous versions. The simple fix is available via the package manager as “Dynamo Future File.” (More information about this can be found on the forum here). The general suggestion is to have this package in place for your Dynamo deployments if you support Revit 2021 and older.
 Dynamo Future File! |
And with that in place, the graph opens! (Notice the nodes are more spaced out. However, this allows for compatibility between 3 versions of Revit!)
 Window Wall Ratio Graph in Dynamo 2.6.1 |
Handling Dropdowns
Dropdowns are an essential part of Dynamo Player and the general user experience. Additionally, dropdowns have been fixed to remember their selection as of Dynamo 2.12.x. However, with this power comes a few considerations. One of the biggest considerations is demonstrated above regarding managing compatibility with multiple Revit versions.
Even with all of this in mind, I generally suggest that you (as the graph author) hardcode any dropdown items that you do not want a user to be able to change. There is always a chance that the category is slightly different or the element type (or class in Dynamo 2.13).
There are a few ways to handle this.
 |
For more information on the ways to convert these dropdowns, check out Dana De Filippi’s post on the Autodesk Community Voices Blog.
Custom Package Usage
Custom packages are community-built toolsets to add functionality to Dynamo. More on packages can be found on the Dynamo primer here.
But as with most things in Dynamo, you need to have a plan for how to handle these workflows. Generally speaking, the use of packages that have been updated recently is really stable. Some of the “must-have” packages can be found within the first 20 or so most downloaded on the Dynamo package manager.
But, the main considerations are as follows.
If a package uses Python, it more than likely uses IronPython 2.7. IronPython was removed as the default engine in Dynamo 2.13, resulting in a few issues when managing graphs between versions. More on the “why” of this change here, Dynamo 2.13 Release Part 3/3.
Thankfully, you can still install the dependency yourself from the package manager (while accepting the potential downsides of using an older engine).
 |
In addition to Python considerations, some packages require specific versions to work in your version of Revit. So always read the notes on the package and judge for yourself if deploying it is worthwhile.
 Pictured: Archi-Lab. This package requires a specific version per Revit version based on the complexity of the package itself. (AKA, this package does a lot of cool stuff) |
Want more tips and tricks about managing Dynamo graphs for your firm?
Be sure to check out the Autodesk University Class below.